The Pool Is Full as Bulls Jump the Fence
Let's discuss how sentiment took a big turn in the last week and what it means for the market. Plus, a look at a whole bunch of stocks, including AMD, Shopify, Robinhood and Cleveland-Cliffs.
You've reached your free article limit
You've read 0 of 1 free Pro articles.
The Market
A week ago, just back from vacation, I said I was surprised. I had a laundry list of things the market had done that surprised me. One of the items on that laundry list was sentiment.
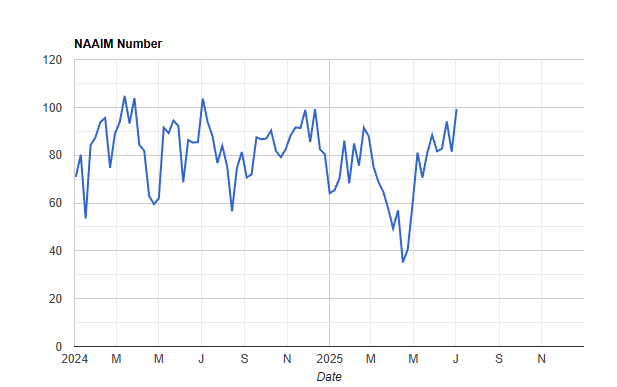
I said I was surprised the NAAIM folks who had been nearly ebullient the week prior had pulled in their horns as they went from the low 90s in exposure back to 80. But this past week changed that. They are now kissing the 100 mark. This would be the highest since a year ago. As a reminder, over 100 and they are on margin.
I was surprised that we hadn’t seen an equity put/call ratio in the 40s since early to mid-May. That too changed on Thursday when this metric chimed in at 0.48.
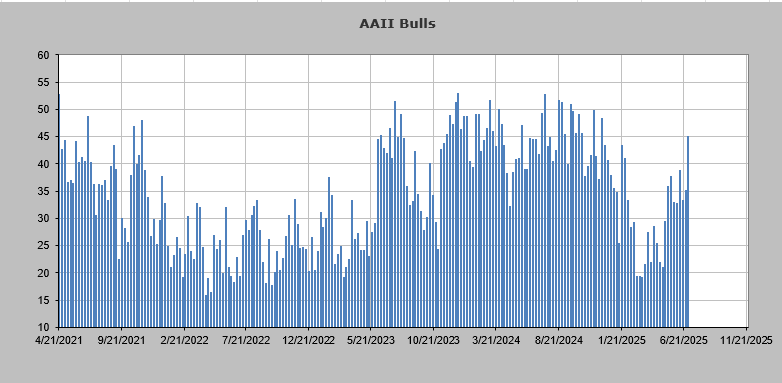
I was surprised the AAII folks had not gotten the least bit bullish, but to be fair they have been mostly cautious for nearly a year now, all while being over 60% invested. Yet this past week finally saw this cohort change as the bulls jumped ten points to 45%, the highest reading all year. It is not that this reading is extreme, but they clearly finally jumped the fence.
Last Wednesday I noted the big shift in the Investors Intelligence survey as the bulls jumped 12 points week over week.
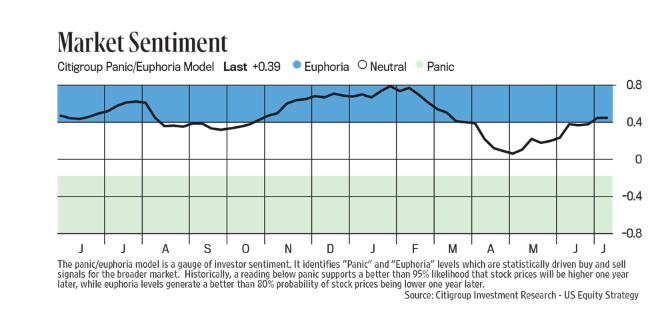
The Citi Panic/Euphoria Model, which a week ago was kissing the underside of "Euphoria," managed to get itself into the bottom end of Euphoria this week. Again, this is not extreme, but I am no longer surprised because sentiment took a big turn in the last week.
Finally there is the DSI. The reading for the VIX is now 16. A reading under 15 is a big yellow flag; single digits is a red flag. The S&P 500 scooted right up to 87 and the Nasdaq is at 86. Over 85 is the yellow zone, while over 90 is the red zone. Let’s call this extreme.
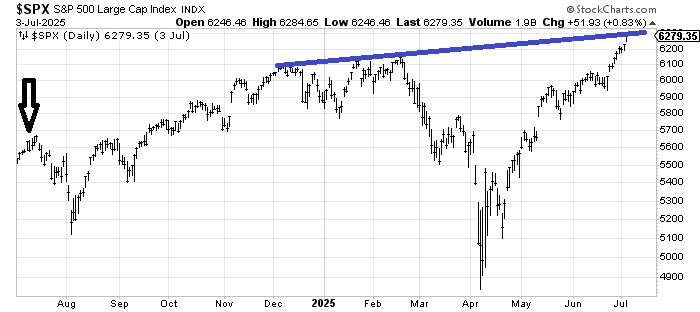
Does that mean the market must go down? No. In fact in mid-July last year we saw the DSI for Nasdaq reach into the low 90s but it took until the final week of the month for it to matter. And then came that early August whoosh. So the timing isn’t perfect day to day but it gives us a general sense of when the pool is full and right now the pool is full.
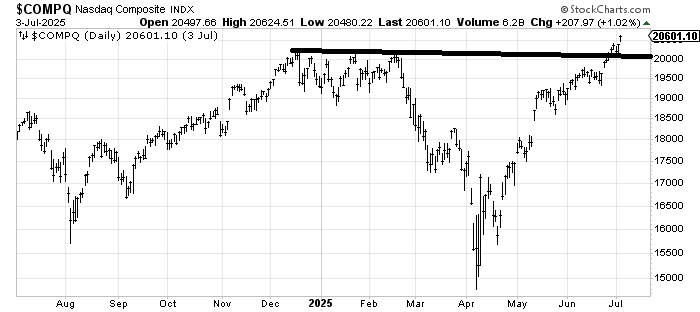
The arrow on the chart of the S&P shows that period of time last summer when the DSI got extreme. I have also drawn in a very thick (some will argue too thick!) line that shows some resistance here, although the Nasdaq has cleared a similar line (the Nasdaq’s line is flatter, not upslanting).
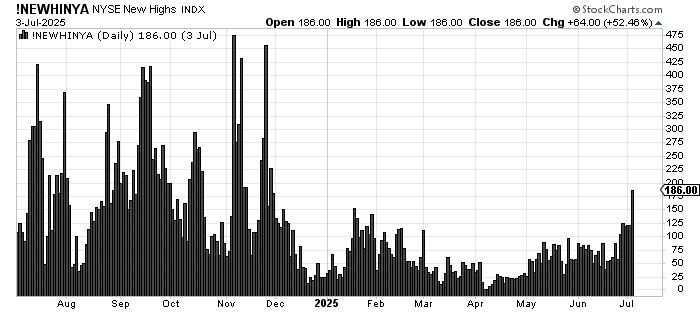
Keep in mind breadth is good, the number of new highs has expanded from where it was, but the market is now overbought with sentiment getting quite extreme.
New Ideas
I still have a very long list of requests and some of the charts are good charts that haven’t moved yet, so please look below for individual stock charts.
Today’s Indicator
The new highs have improved but are still well below where they were last fall.
Q&A/Reader’s Feedback
Helene welcomes your questions about Top Stocks and her charting strategy and techniques. Please send an email directly to Helene with your questions. However, please remember that TheStreet.com Top Stocks is not intended to provide personalized investment advice. Email Helene here.
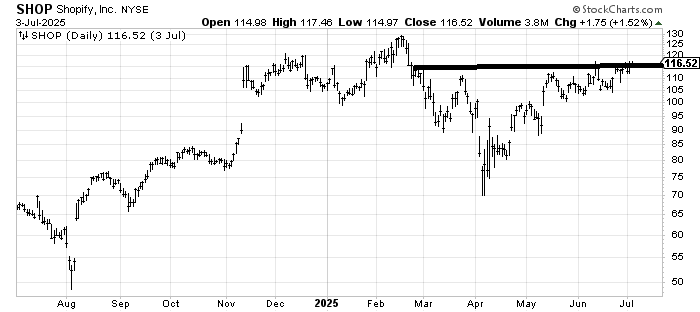
Shopify SHOP has been pretty stagnant since mid-May. If it can get up and over this resistance I’d consider it bullish. Under $105 and the stock is in trouble.
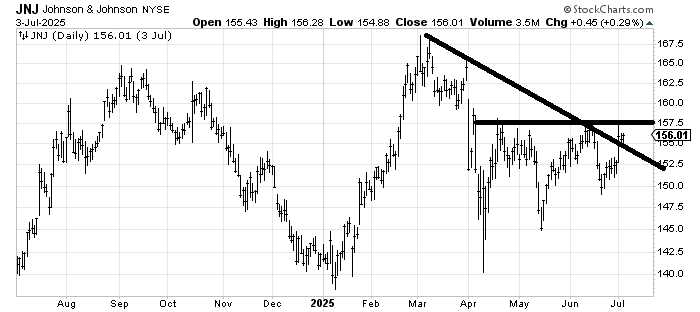
Johnson & Johnson JNJ has not been one of the drug stocks I have liked in this recent move up for them. But the chart is now very interesting to me because it crossed that downtrend line and is knocking on the door of that flat resistance line. It’s probably worth a shot.
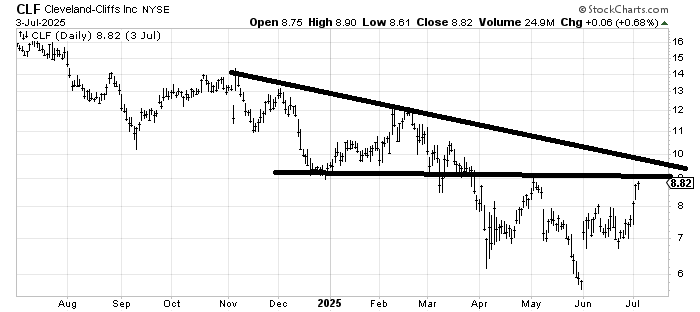
Cleveland-Cliffs CLF has a lot of resistance to contend with in the $9-10 area. I suspect the stock tries to eat through it but in the near term that’s resistance.
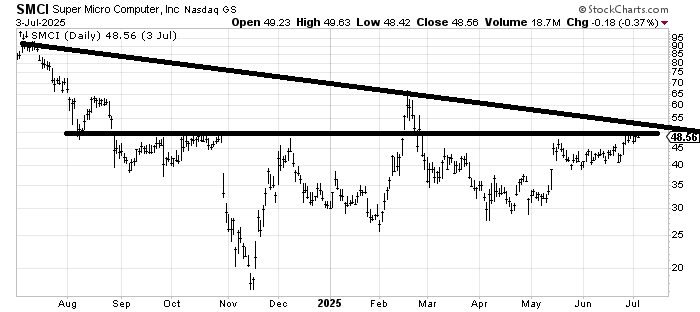
Super Micro Computer SMCI has gone nowhere for nearly a year, which immediately makes me suspicious when a tech stock has sat it out. A move over the resistance would be a big plus but the stop is far away under $40. If it can stay over $40 on a pullback it would be enticing.
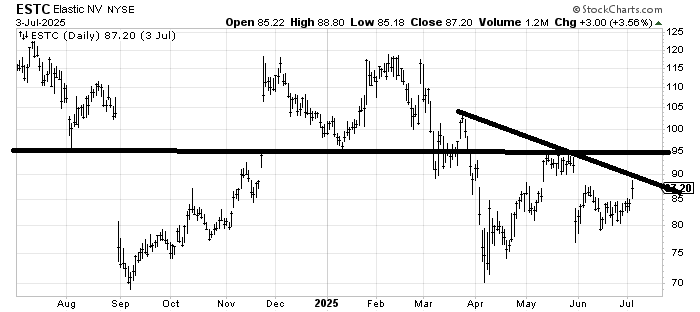
Elastic N.V. ESTC is a very odd chart with all those gaps — up and down. And all that resistance overhead. It fills one gap at $90, and if it gets through that $95 is another problem. If it gets over $90 I would imagine it then spends some time in the $90-95 area. Notice none of the gaps, again up or down, have follow through. The gaps up stop dead in their tracks as do the gaps down.
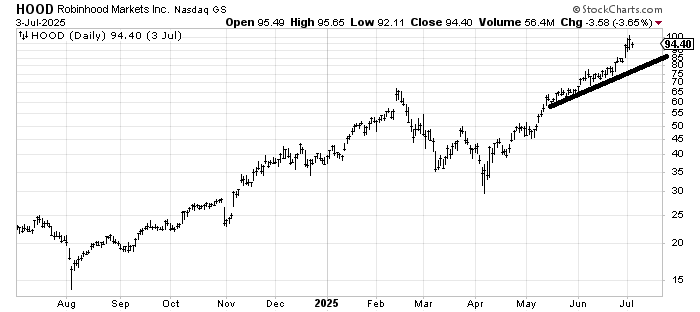
The only thing I see in the chart of Robinhood HOOD is that it met its measured target when it tagged 95. It also completed the 90/100 rule (90% of stocks that get to 90 will get to 100). And it is over-extended. If it can pull back to the line that would be helpful.
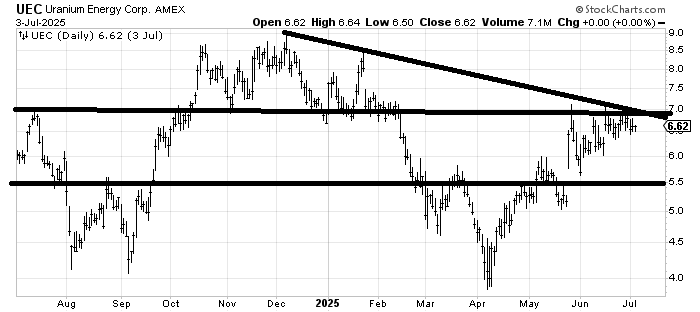
Uranium Energy UEC ran smack into resistance, so unless it can jump up over $7 I’d say it’s in a trading range between $5.50-7.
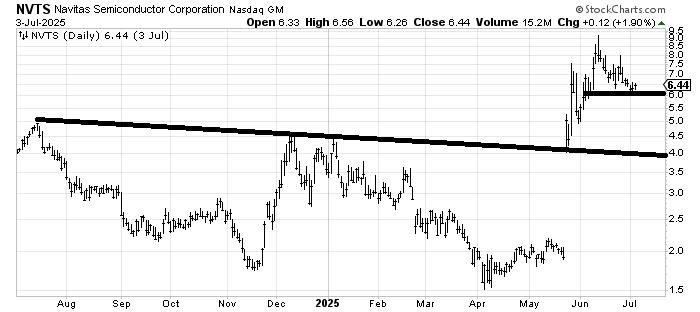
If Navitas Semiconductor NVTS can hold this $6 area it is starting to look oversold enough for a bounce. A prolonged sideways (say between $6-7.50) would probably shape the chart up better.
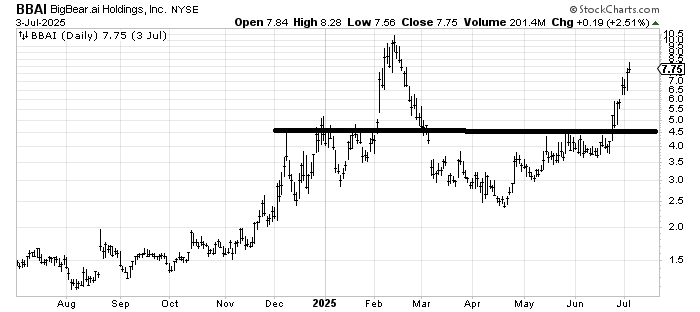
Big Bear.ai BBAI has had quite a run. I would not chase it here. I would take another look at it if it can correct and stay over $6.
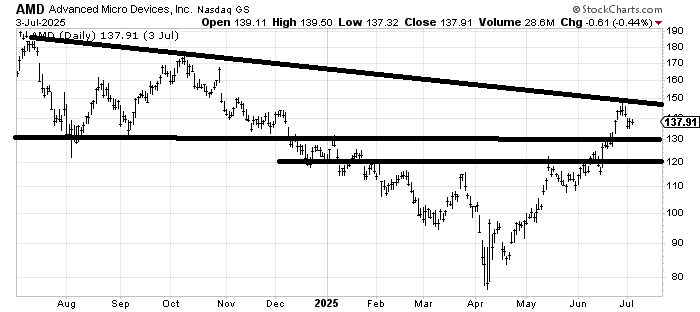
I believe it was late May when I recommended Advanced Micro Devices AMD but it has now run smack into resistance. It probably rallies again but I’d be in favor of taking a few profits and waiting for a better setup. There is some decent support around $130.