The People Are Beginning to Give Up
Let's take a look at the surveys and options data to see what people are doing in this market.
You've reached your free article limit
You've read 0 of 1 free Pro articles.
The Market
There was a very big change in sentiment today. Oh sure, you’re thinking the last three weeks have seen the AAII bears at 60% (you already know what I think of that survey). This week the Investors Intelligence folks joined them when we flipped to more bears than bulls.
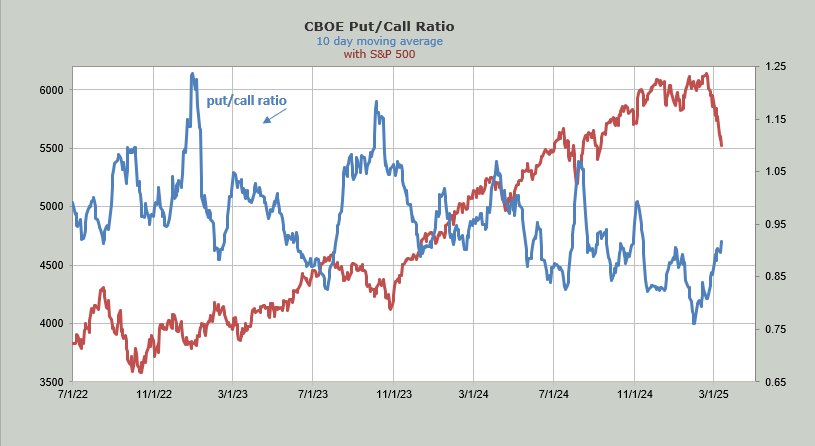
But today was the first day with the put/call ratio over 1.0 since January 2nd. And this is only the second time since the election we’ve seen the put/call ratio over 1.0. That folks, is a change.
It’s not enough for us to get excited over the ten-day moving average of the put/call ratio since, as you can see, the truly good spikes in it have been much higher, but this is a welcome change.
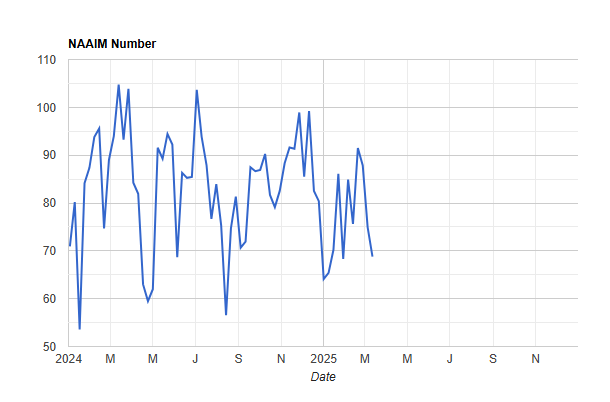
The flip side of this is that the NAIIM folks have only reduced their exposure to 68. They had less exposure in January and much less in August, or even during the first half of the year in 2024. I can’t explain the holding out there since, in prior declines, they were pretty quick to reduce exposure, but at least it is heading in the right direction.
While there was no panic, anecdotally it is starting to feel a bit like folks are giving up. Some permabulls who were screaming “the bottom is in” a week ago now tell us that there will be a correction but no bear market. I’ll call that a downgrade (!!). After three weeks of saying we should buy because the AAII bears are 60%, very few said that today. The market wears you down.
We’ve seen several Wall Street firms downgrade their asset allocations to stocks. And some have even lowered their price targets for the S&P. This is all anecdotal.
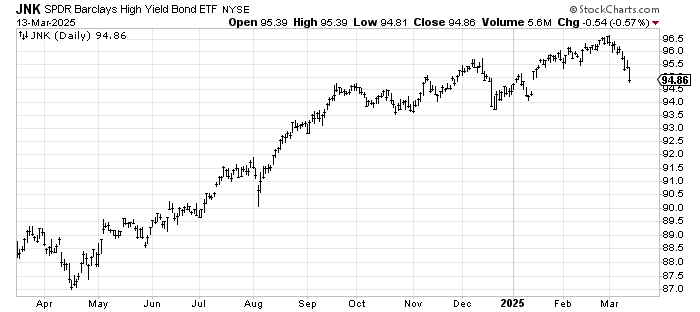
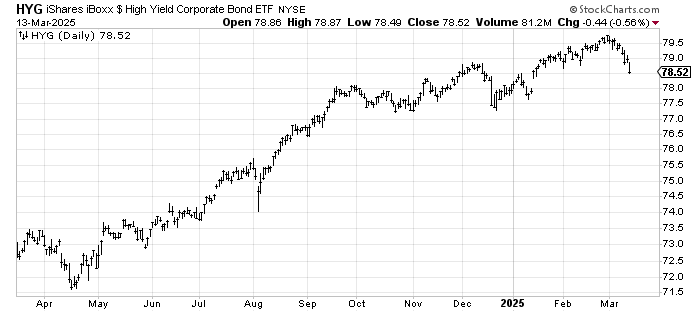
Something else occurred today. Folks finally felt compelled to sell JNK and HYG. Some might view that as a step in the right direction, while some might say, it’s not good because credit is getting worse. I say it’s a bit of both. They are selling due to a change in sentiment.
In any event, for the most part, the week has been a giant sideways when you look at a chart of Nasdaq (S&P looks like this, too).
After having all those red Fridays since the inauguration, we’ve now had two in a row where the market closed higher. I do believe if we close in the red on Friday sentiment will get even worse. The DSI for the S&P is at 27 and Nasdaq is at 25. These two now go on our daily watch list.
New Ideas
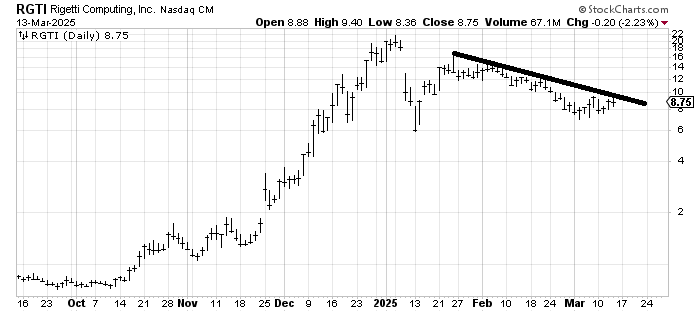
Rigetti Computing RGTI which I looked at with a positive eye earlier this week, continues to hold up well. I’d like it to stay over 7.75, and I’d like it to cross 9.75.
Today’s Indicator
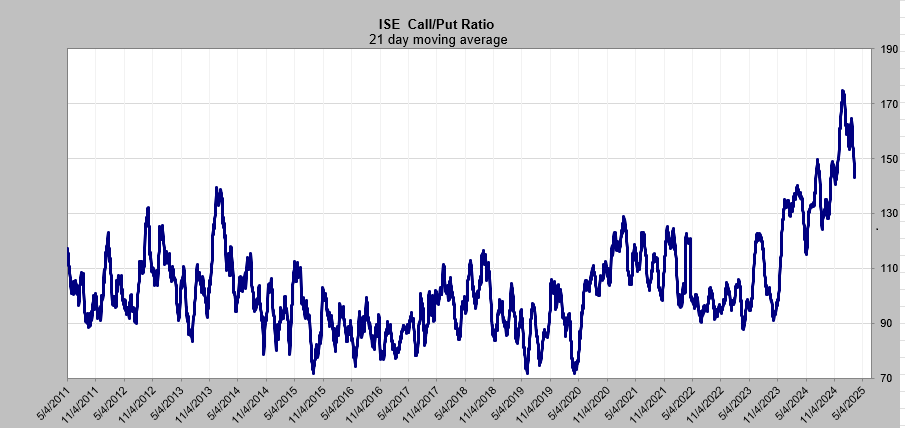
The ISE call/put ratio’s 21-DMA has come down. Oh, not enough to call it bullish, but it, too, is heading in the right direction. You can really see the call buying has slowed.
Q&A/Reader’s Feedback
Helene welcomes your questions about Top Stocks and her charting strategy and techniques. Please send an email directly to Helene with your questions. However, please remember that TheStreet.com Top Stocks is not intended to provide personalized investment advice. Email Helene here.
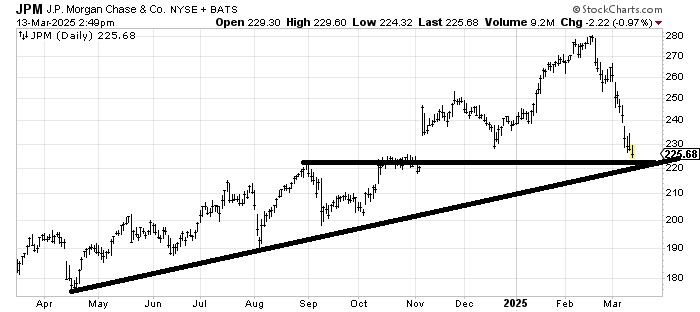
I have not been a fan of the banks for a while now, but I did think Goldman Sachs GS could rally earlier in the week (it has not done so). And now I am asked about JP Morgan JPM which also looks terrible but has a decent amount of support in this 220-225 area and a gap fill. It ought to bounce. I’d sell a bounce to 240 if it got there.
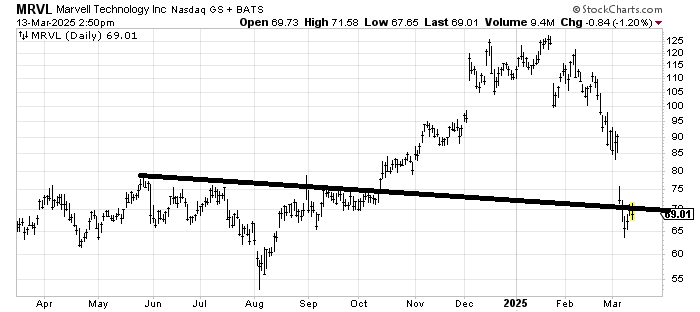
I would have expected Marvel MRVL to rally from that 70 area, but like so many stocks, it has not even taken a breather at support. Here, too we should see a bounce. A gap fill might be tough in this market, but 75 on any oversold rally should be doable.
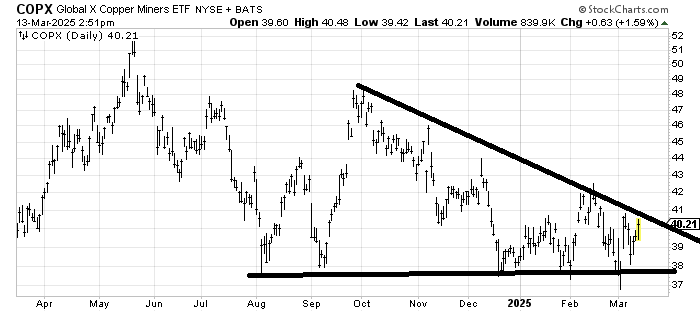
COPX is an ETF for copper miners, and it really needs to get over 41. I had mapped out a path that I thought FCX (in the ETF and a very similar pattern) ought to take, and while it has varied somewhat, that’s the path it is taking. If it cannot get over 41 in the next 2-3 days, it’s a problem, but mostly it still feels as if it is early but trying to bottom.
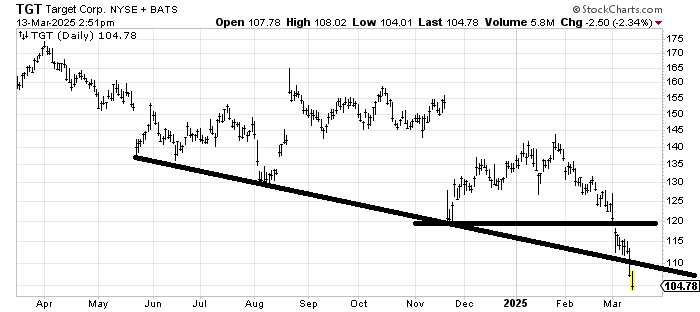
Target TGT has fallen out of support on two fronts: the flat line and the slanted one. That flat line pattern measures to around 100 but as I said the last time we looked at it a few weeks ago, bottom fishing in it hasn’t paid.