The Penny Stock Traders Are Back
Penny stocks are important to watch because they indicate speculative activity.
You've reached your free article limit
You've read 0 of 1 free Pro articles.
The Market
More grinding around. That’s six straight days of green for the S&P. A down day on the last day of the month would actually be fitting, just to shake things up. And just to get the anecdotal chatter calmed down.
The indicators saw very little change as breadth continues to be good, so the intermediate-term indicators inch upward while the short-term Overbought/Oversold Oscillator ticks down from the loss of momentum after last week.
Chatter-wise, it really does feel as though folks are getting bullish, but I can’t yet cite any data for that. The put/call ratio is not high at .88, but it’s not giddy. If we do get a down day and then rally again, I suspect we see a change. It’s hard to get traders all bulled up after six straight up days.
Away from that, I want to note that we do, in fact, see speculation running rampant again as we did back in January. In January, we saw volume in penny stocks on Nasdaq surge, and once the market pushed lower, that nonsense stopped. However, this week that has begun again.
To wit: yesterday’s volume for Nasdaq was just over ten billion shares (that’s a lot, as average volume tends to be closer to 6-7 billion shares. But today? Today was just over 13 billion shares. The peak reading for Nasdaq volume was in early January at 13.5 billion shares.
What do we owe all this volume to? Today we have three penny stocks, and I do mean pennies because not one trades over a buck, that accounted for approximately six billion of those shares.
If you are wondering why I fuss so much over these penny stocks, it’s because William O’Neil told us that if the market leaders begin to falter and the lower-priced, lower quality, more speculative stocks begin to move up, watch out!
We have not yet seen the leaders falter as we did in January. But we’ll watch for that as the SOX has now been red for two straight days.
I still think we are more apt to chop than anything else. In that chop, we are probably going to see up days that make us wonder and down days that make us wonder as well.
New Ideas
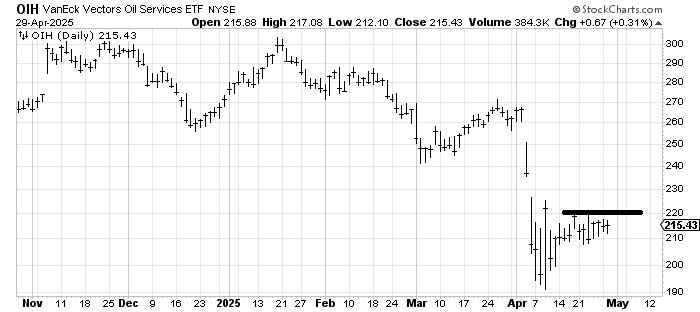
Energy stocks have rallied, but not very well. And oil took it on the chin again today. It has caught my eye because the DSI for oil is now at 14, the lowest since May 2023, when it got to 10. Oil stocks ignored the decline in the commodity today, so if oil can rally, maybe OIH can get over 220 for a trade.
Today’s Indicator
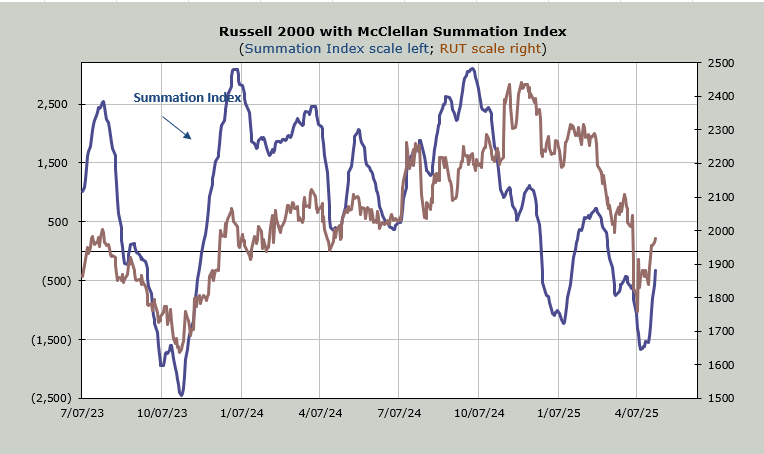
The McClellan Summation Index is still heading up and needs a net differential of -4200 advancers minus decliners on the NYSE to halt the rise (that’s what makes it overbought).
Q&A/Reader’s Feedback
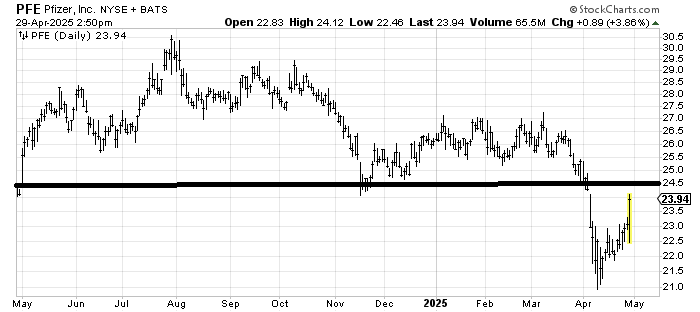
Pfizer PFE has been a terrible stock, but today’s turnaround gives me some hope. I think there is a lot of resistance at 24.50-25.50, so it’s hard to get too excited over it. But at least if it can get over that line, it starts a bottoming process.
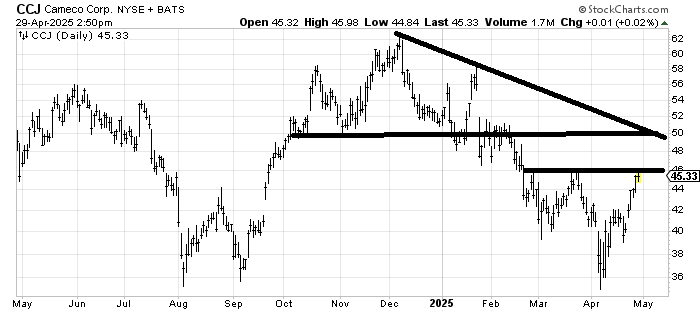
Cameco CCJ has some resistance here. A pullback would give it the look of a head-and-shoulders bottom. Either way, resistance gets quite heavy near 50, so I feel as if it would be better if it pulled back first because that would represent more ‘work’ being done to eat through the resistance.
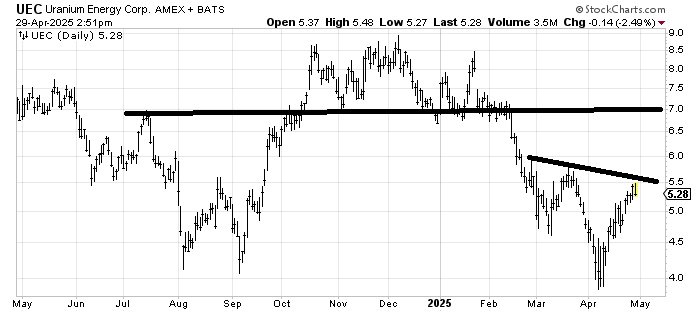
Uranium Energy UEC might also be working on a head and shoulders bottom if the stock pulls back and holds over 4.50 (best would be holding over 5) then I would think it is working through the bottoming process.
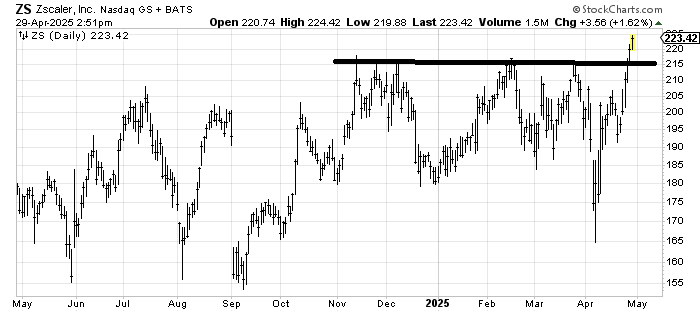
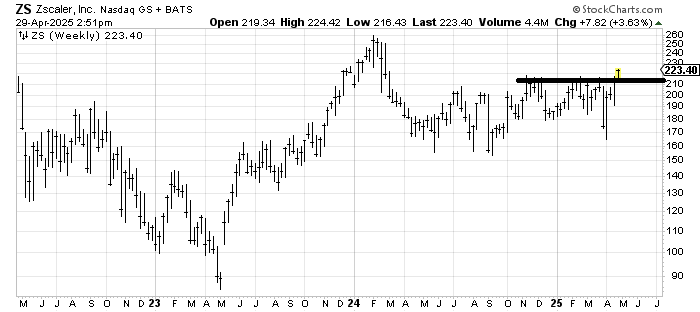
Zscaler ZS is a chart we’ve looked at before with a positive eye, and it is finally breaking out. I hate to chase stocks, so a pullback near the breakout (215) would be a positive. But the stock measures near the old high, around 250-ish. They report a month from now.
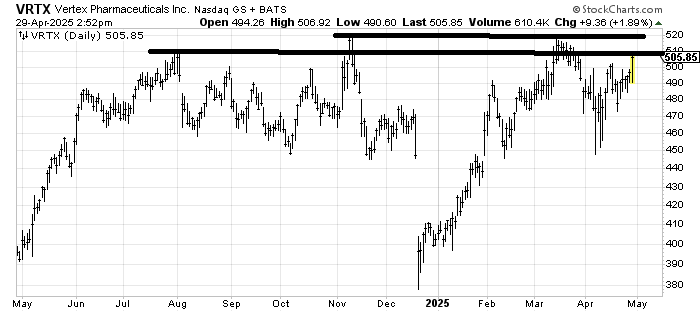
Vertex Pharmaceuticals VRTX is forming a high base, which I am not a big fan of. However, that gap down in December looks like a clean-out. Earnings are next week, so I shy away from getting in front of earnings. A move over 520 would be a breakout.
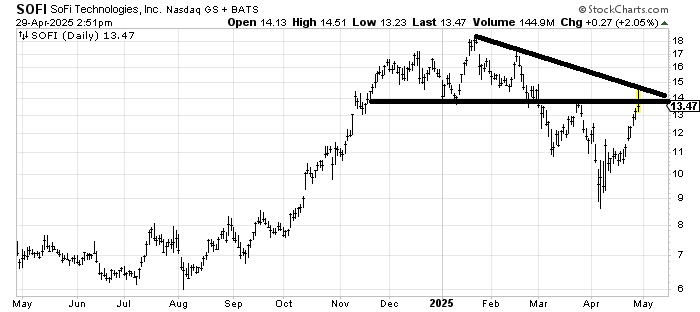
SoFi SOFI is doing exactly what it ought to: pulling back from resistance. Similar to the GOOGL chart we looked at the other day, a pullback ought to lead to another rally. It’s when (if) the next rally cannot chew through resistance that the stock goes from ‘trying’ to ‘no more’.
Helene welcomes your questions about Top Stocks and her charting strategy and techniques. Please send an email directly to Helene with your questions. However, please remember that TheStreet.com Top Stocks is not intended to provide personalized investment advice. Email Helene here.
