The Options Market Will Add Fuel to the Fire
As February begins, look forward to more volatility. Options traders could add fuel to any stumbles.
You've reached your free article limit
You've read 0 of 1 free Pro articles.
The Market
The pattern of the market last week was almost exactly as it should have been. We got short-term overbought and went into a chop mode. We also had some bouts of volatility even as the S&P gave us an every other day up/down scenario.
It’s not as clear to me what this week will bring, but we have the intermediate-term indicators heading back to an overbought condition later this week, and we have still not fully worked off the short-term overbought condition.
When we step back and take a bird’s eye view, though, one thing jumps out at me: despite the rally back to the old highs, I can only find two groups/charts that made it back to their old highs. One is gold, and the other is the banks.
Everything else was mostly an attempt at a rally either off those severe December lows or more shuffling about in the tech sector. So where does that leave us? I expect February will bring more volatility, not less.
I know I have been harping away at the options ratios lately. It’s not that I think having them so low will be a reason for the market to stumble; it’s that with them so low, they ought to add fuel to any stumble. They are like an accelerant.
Something else I think you should consider is that folks call them the Mag 7 and while we know it’s not always seven stocks, and sometimes they swap around. Take a look at the charts of those seven: Meta, Alphabet, Apple, Netflix, Microsoft, NVIDIA, and Amazon. There are only four that are at their highs now. Just four.
They are no longer moving as a block. They have sorted themselves out. Sure on any given day, Apple or NVIDIA being up will move the index. That hasn’t changed, but they are no longer stocks making new highs. Call it a change under the hood. It’s not about total market breadth vs the index, it’s about breadth among the leaders.
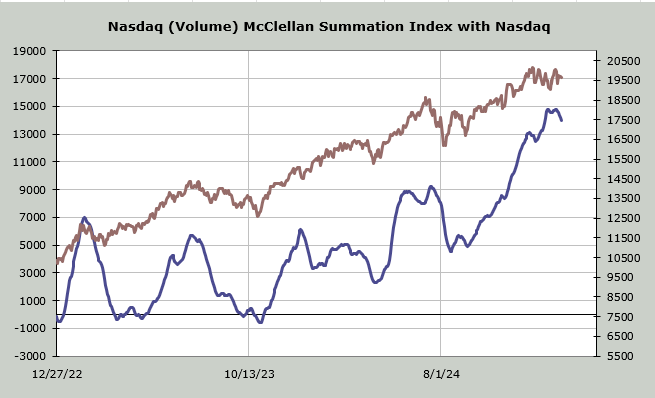
Think about that as you look at this next chart. It is the Nasdaq McClellan Summation Index using volume. Perhaps this tick down over the last few weeks will turn into a nothingburger but it is worth noting that it has rolled over and has tended to do so before a correction.
New Ideas
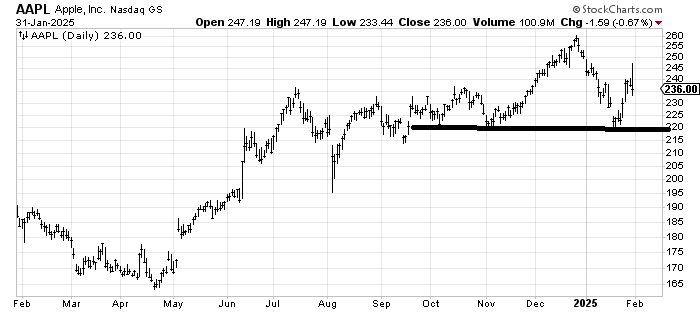
I am going to review a lot of stocks down below (keep the requests coming) so I am just going to follow up on Apple, which we looked at last week. I wanted it to break that support at 220 to then see a rally but it didn’t bother to break, it just went. Now it has had quite a reversal on Friday. I thought it should have rallied to 230-ish but it blew through there, so now I think that 230 area is important on the way down: does it hold? If it doesn’t then a trip back to 220 is probably in the cards.
Today’s Indicator
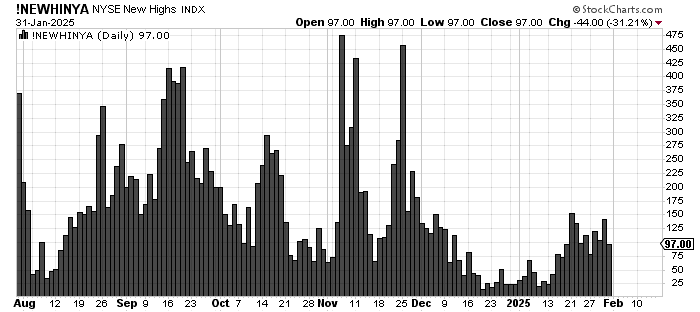
The number of stocks making new highs has been pathetic on this run, because so few stocks/groups have made it back to the old highs.
Q&A/Reader’s Feedback
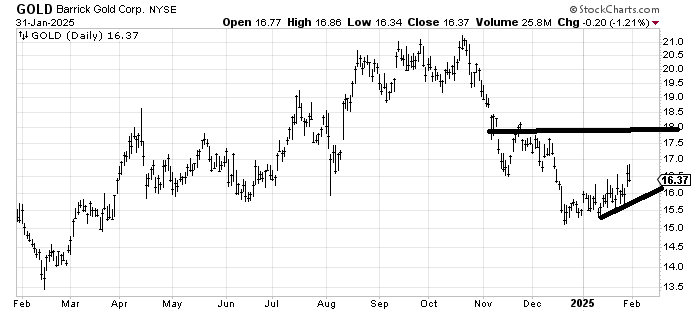
Barrick Gold ABX looks so different than many of the other gold stocks. It’s got resistance all the way up but as long as it doesn’t break 16-ish (that small uptrend line) it ought to make an attempt at 18-ish.
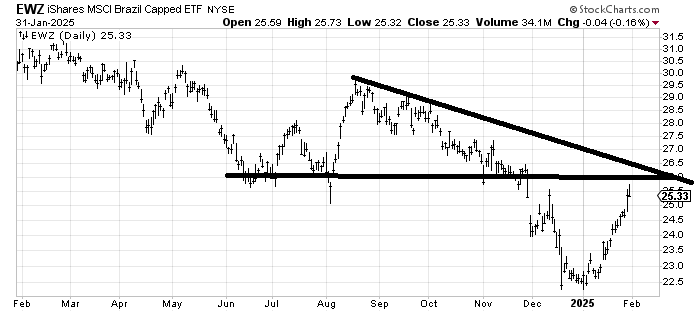
EWZ, an etf to be long Brazil is an interesting chart because it has a lot of resistance at 26 but if it can pullback near 24-ish it would have a head and shoulders bottom so if it got into that 24 area the risk/reward seems good because if it plunges much under there, you know you’re wrong.
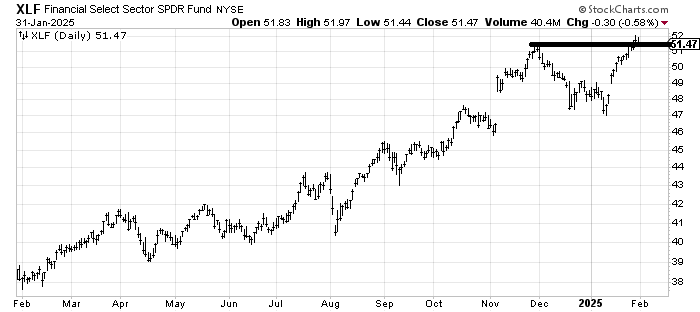
XLF, an etf to be long the financials (not just banks, all financials) is over-extended so on a trading basis I am not a buyer here. I might even take a few profits and look to buy it back on a dip. Mostly I would just call it a hold. It hasn’t done anything wrong yet, it is just over-extended.
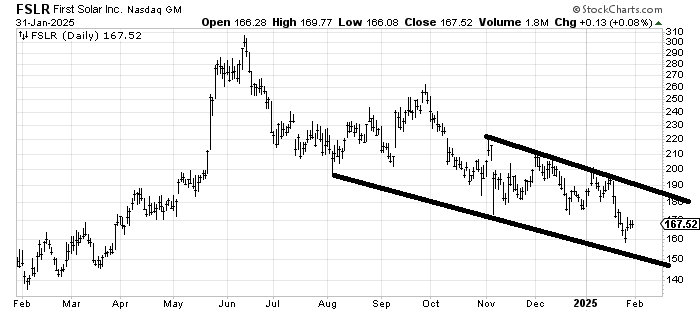
First Solar FSLR has been in this quasi channel for a while—it’s a stock in a downtrend. Unless or until it breaks out of that channel you buy when it tags the lower line and sell when it tags the upper one.
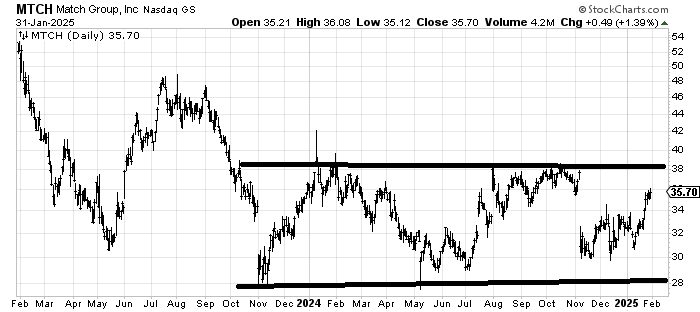
Match Group MTCH has been in a ten point range for more than a year now. I keep thinking it is basing and one day it will bust out and I keep being disappointed. A good sign would be a pullback toward 34 that is slow that then turns upward. If it slips much under 34 I would be inclined to think the range will continue.
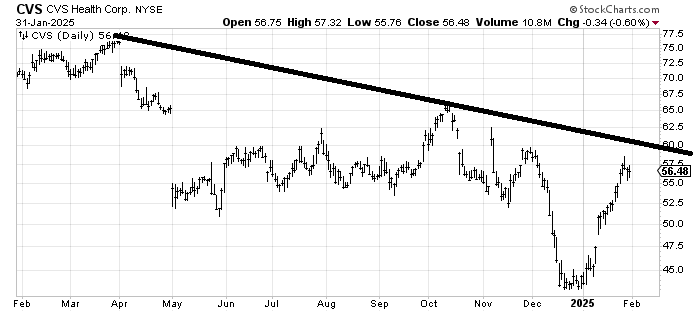
CVS CVS has managed to claw its way back into resistance so if it can make it to 60-ish I’d be more interested in profit taking.
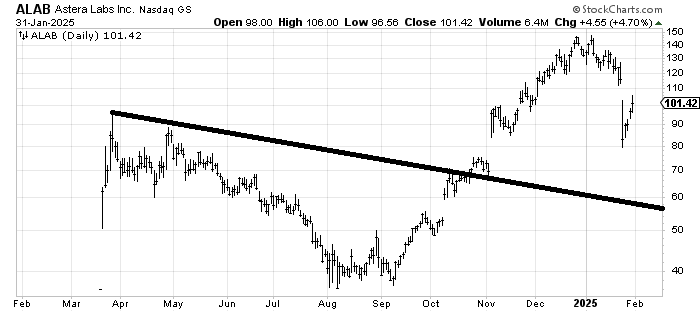
Astera Labs (ALAB) met its upside measured target in December. Now if it closed that gap just over 110 I’d look to sell it.
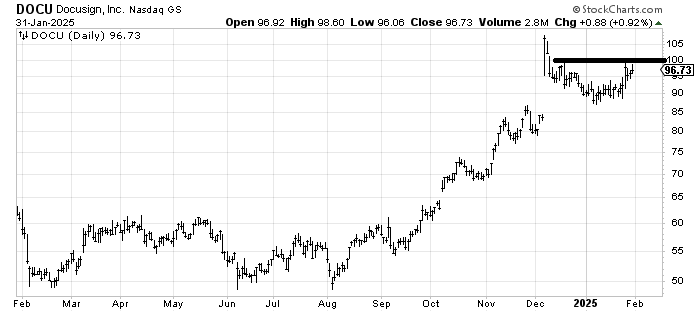
The chart of Docusign DOCU looks quite similar to the Applovin (APP) chart we looked at a week or so ago. Over 100 and it ought to make a stab at the spike high. A failure under 100 and I’d get concerned.
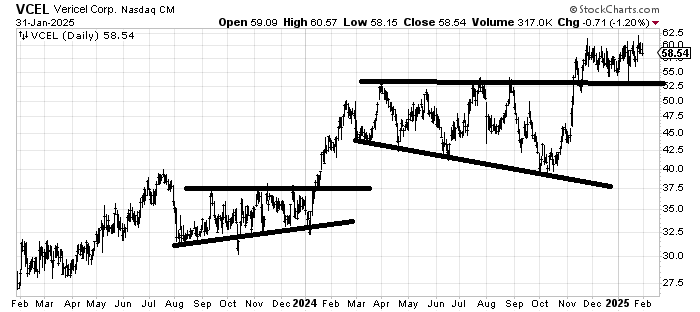
Vericel VCEL has mapped out a pattern over the last few years of rallying and then going sideways for months on end. So as long as it stays over 50-ish I see no reason the pattern shouldn’t repeat. In 2023 it was about six months and in 2024 it was close to nine. Right now it is about three months into the pattern.