The One Stock Chart Investors Should Watch Right Now
If you’re rooting for the S&P 500 and the Nasdaq to continue climbing, you should be watching these shares closely.
You've reached your free article limit
You've read 0 of 1 free Pro articles.
Monday’s rally saved this market — at least for now.
Specifically, it saved one of the most important stocks in the market from sliding past a key level — and possibly taking the broader market with it.
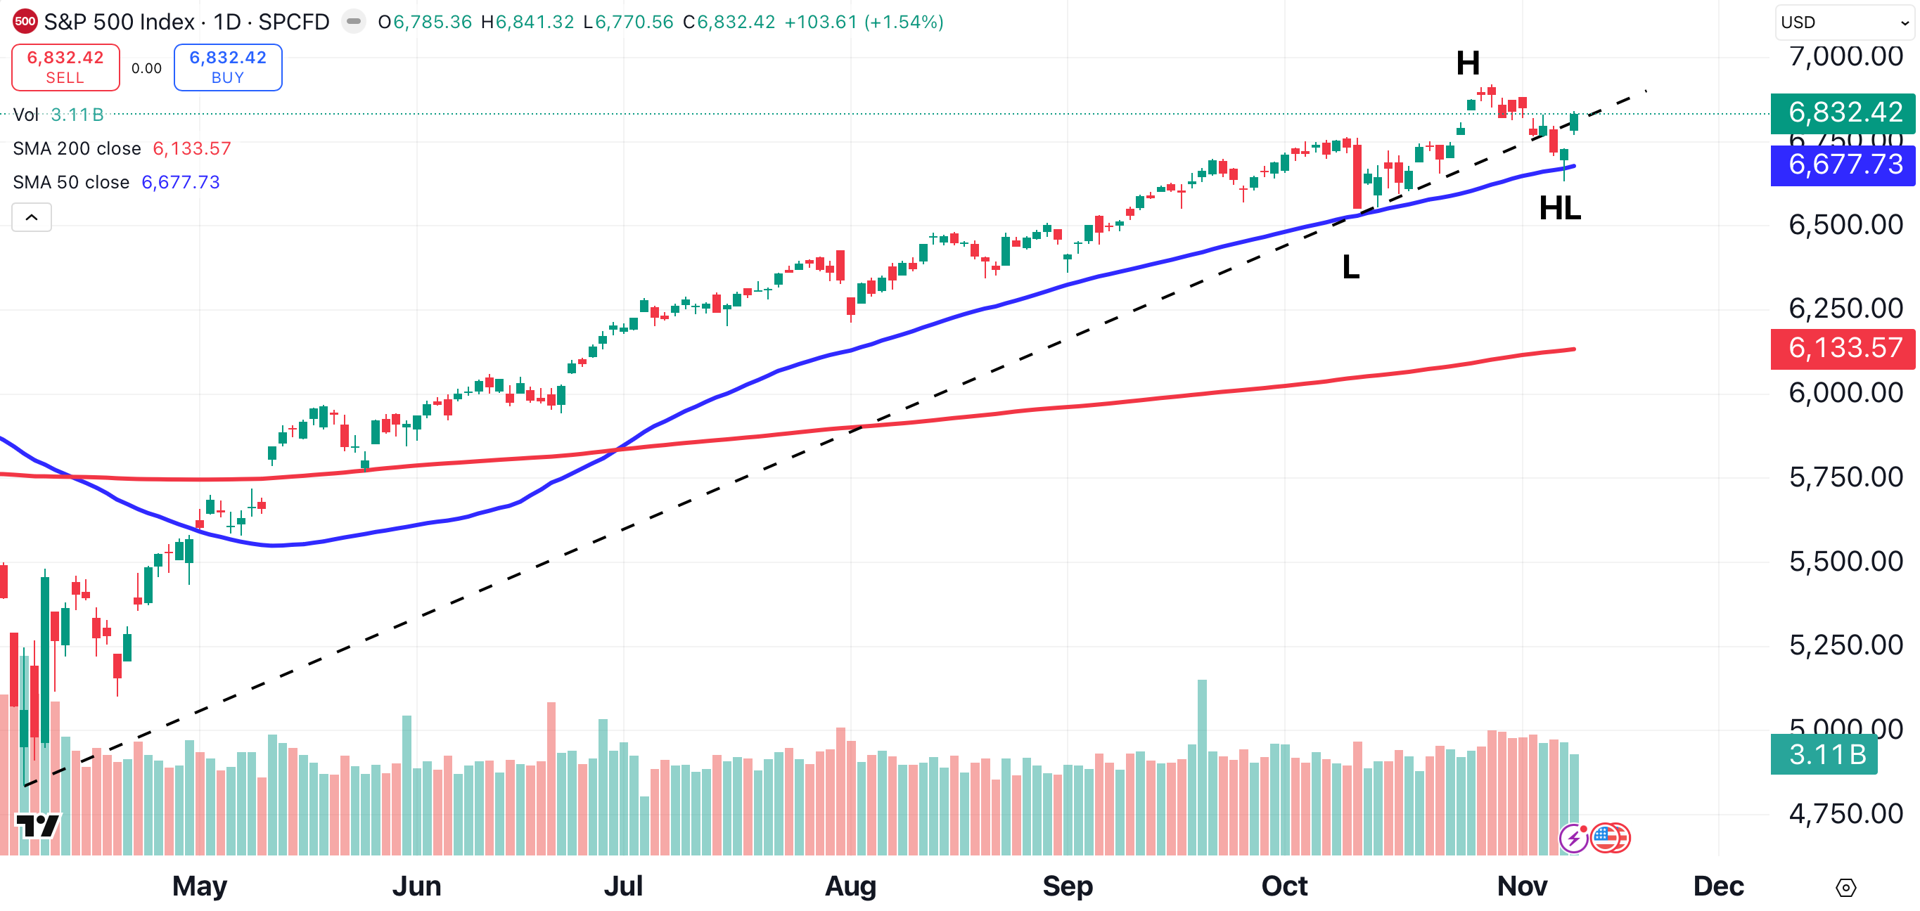
Word that the 41-day government shutdown could end this week pushed the S&P 500 higher by 1.54%. The Nasdaq Composite jumped 2.27%, and the Dow Jones Industrial Average gained 0.81%.
The S&P 500 managed to climb back above a six-month old bullish trendline (black dotted line). The large-cap index formed a higher low (HL), keeping its bullish trend intact. The index ricocheted off support in the form of its 50-day moving average (blue).
For the moment, concerns about AI profitability, addressed here, were put on the back burner.
Not long ago, I indicated that I’d be a buyer of Microsoft (MSFT) if the stock fell to $500. Last week, the Redmond, Wash-based software giant reached that price, falling as low as $493. Now we’re long, with Microsoft closing at $506 on Monday, a day that saw the stock rise 1.85%.
Compare that to Nvidia (NVDA) , which gained 5.79%, Palantir (PLTR) , which jumped by 8.81%, or shares of Alphabet (GOOGL) , which climbed by 4%. In comparison, Microsoft’s gain seemed feeble.
Upon further review, Microsoft shares fell for nine consecutive days prior to Monday’s understated bounce. A bearish double-top pattern (arrows) has formed over the past four months. The neckline support of that pattern comes in at about $492.50 (solid black line).
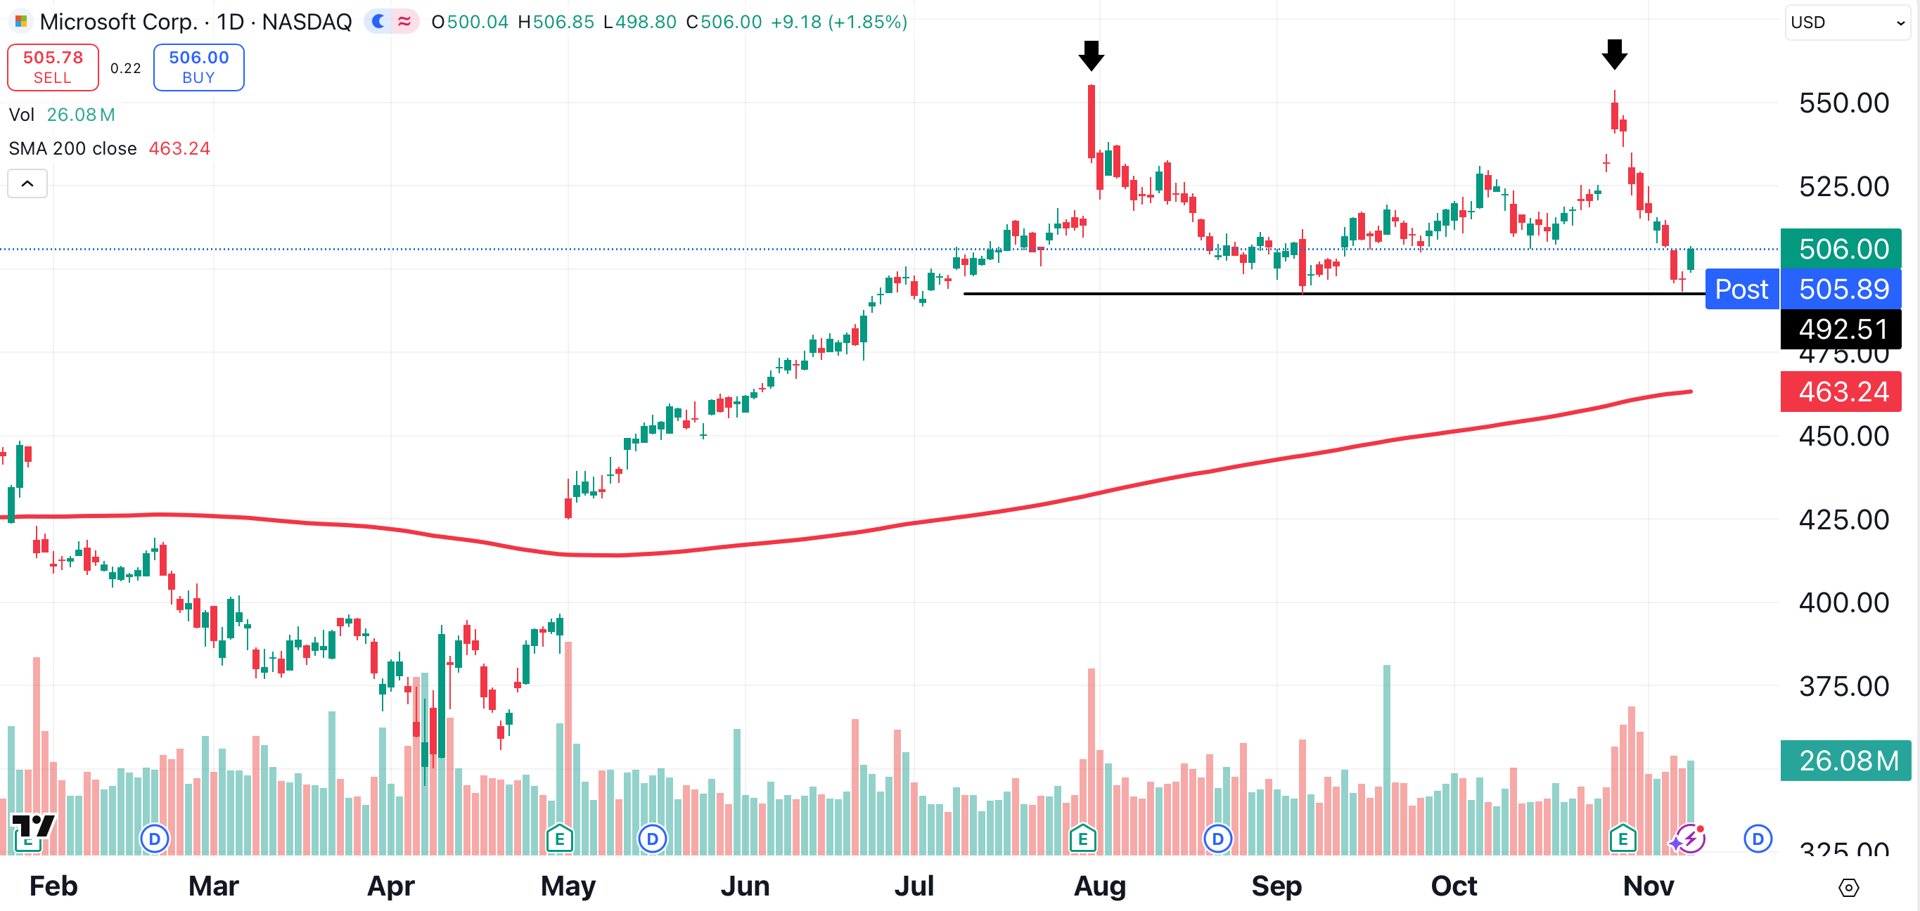
I don’t mind holding a long position in this stock, since support recently held. However, I’d be concerned if the price should turn and break below $492. If Microsoft does break down, the next level of support is the stock’s 200-day moving average (red), currently near $463.
Why should investors be concerned about Microsoft’s fate? With a market capitalization of $3.76 trillion, Microsoft is the third-largest stock on the S&P 500. It accounts for over 6% of the weighted index. It is also the third-largest stock on the Nasdaq 100, accounting for over 11% of that index.
In other words, if you’re rooting for the S&P 500 and the Nasdaq to continue climbing, you’re rooting for Microsoft to stay above support. A break below $492 would exacerbate the selling pressure on the stock. Due to Microsoft’s size and weighting, there could be negative repercussions on the broader market.
At the time of publication, Ponsi was long MSFT, NVDA, and PLTR.
