The Mom Indicator Has Not Signaled a Bottom Yet
Helene's mom has been a reliable indicator of market bottoms. Let's take a look at this and other indicators. Plus, answer your questions.
You've reached your free article limit
You've read 0 of 1 free Pro articles.
The Market
Was that it? Is this never-ending correction finally done? Here’s a partial list of what I like to see to get really excited about a low in the market. And what we got.
High downside volume, preferably a 90% day. It shows panic. We did not get that.
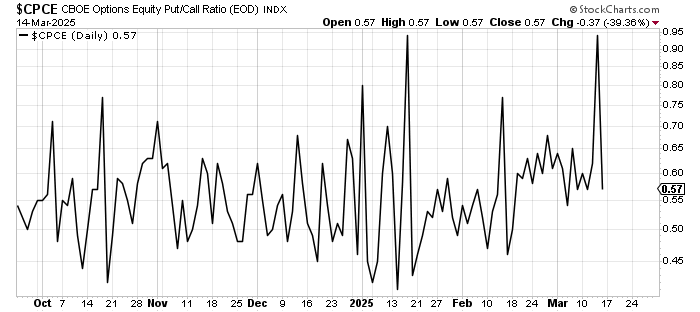
A super high put/call ratio; a reading well over 1.0 is good, preferably for several days, which gets the ten-day moving average of this ratio over 1.0. That shows panic. We did not get that.
What we did get in terms of the put/call ratio was that last Thursday saw the equity put/call ratio soar to .94. I consider that a positive as it finally showed a modicum of panic or at least a strong desire to hedge.
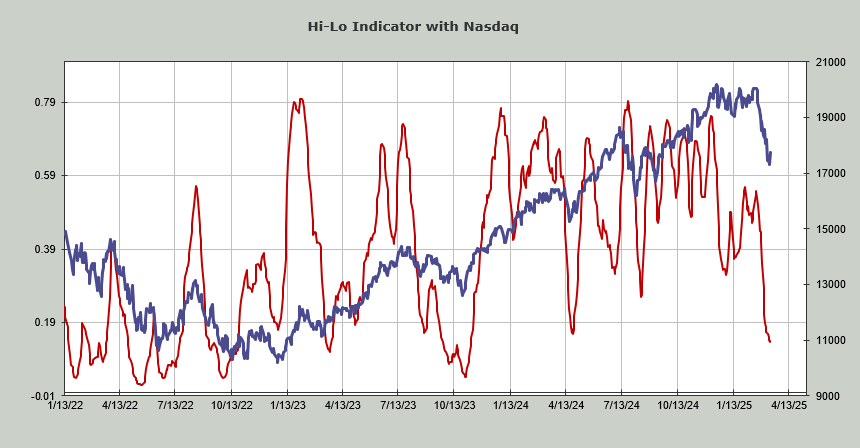
My intermediate-term indicators are grossly oversold. We have one, maybe two, that are oversold (Nasdaq’s Hi-Lo –shown below--and the Volume Indicator, which got to 46% but got to 45% in January).
It would also be nice if my mother called about the market (this is part tongue in cheek and part very real). She has not called regarding the market.
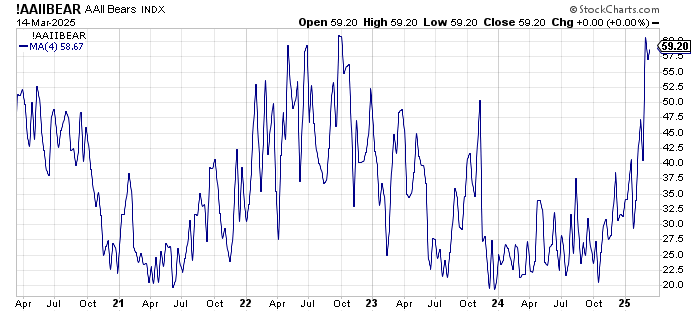
More bears than bulls in the AAII survey. We’ve had that for three straight weeks. As a reminder, I mostly think this survey is garbage but when it is confirmed by other surveys/indicators it is useful. The 4-week moving average of bears is now at 59% which is historically high and therefore bullish.
More bears than bulls in the Investors Intelligence survey. We got that last Wednesday for the first time since the fall of 2022. That makes it bullish. We also had such a reading in the spring of 2022, and it was bullish, for a few weeks. It was good for a decent trading rally.
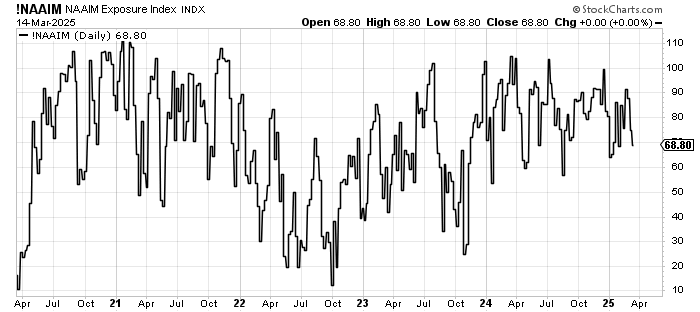
The NAAIM Exposure is low. I have no particular level, but under 50 tells me there was some real shift taking place. It is currently at 68 which I think we can agree is not low. In October 2023 that level got to 24 and in October 2022 it got to 12.
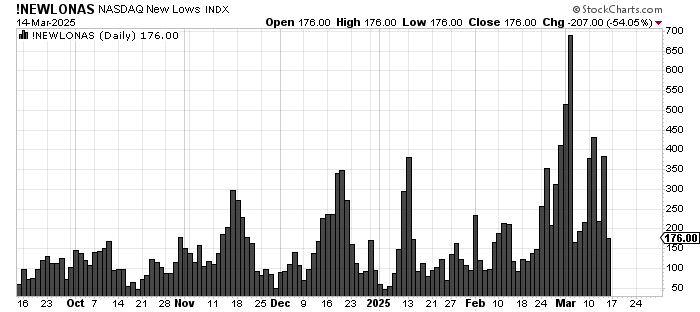
I like to see fewer stocks making new lows. We have gotten that. The peak reading for new lows came on March 4th so for two weeks the majority of stocks have been making higher lows.
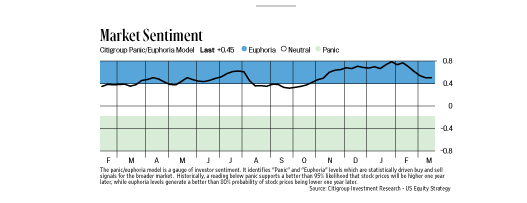
It would also be nice if the Citi Panic/Euphoria Model would fall out of Euphoria. It has not. Sometimes, I question if this indicator chart, which I extract from Barron’s each weekend, is delayed. Friday afternoon I saw the Chief Strategist for Citi interviewed and he commented that the indicator was still in Euphoria so perhaps this chart is quite current.
Here are a few other sentiment indicators that had marked changes in the last few weeks.
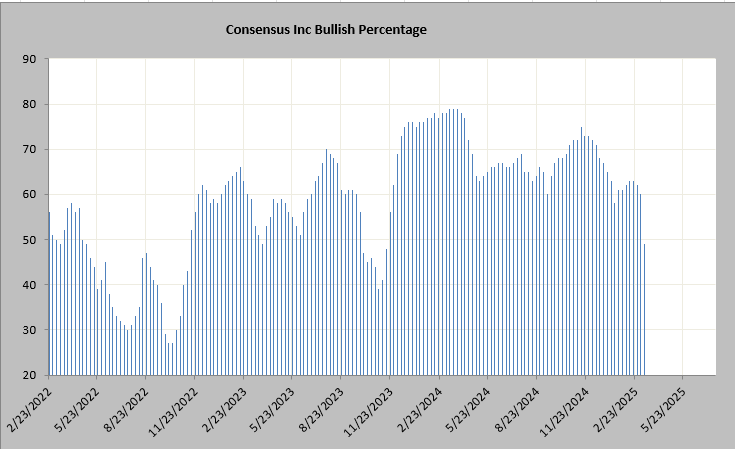
The Consensus Bulls, which were knocking on the door of 80 a year ago and even got to 75 in November, are now at 49, the lowest since they fell to 38 in the fall of 2023 (note they were much lower in the fall of 2022).
The Market Vane Bulls are now 57, down from over 70 a few months ago. This too is a change in sentiment, but here again, they were at 36 in 2022.
Away from that, Friday saw 90% of the volume on the upside. Was that panic to get in? Was it panic to cover shorts? I don’t know, and I have seen studies that say a 90% up volume day can be bullish, but if it arrives in a bear market, it isn’t. So, we’ll set that aside for now and chalk it up to folks buying for whatever reason.
My short-term Overbought/Oversold Oscillator ‘says’ we should give the market a chance to rally some more. My sense is if we get an outsized rally early in the week, we will see sentiment shift away from bearishness pretty quickly, and that would be problematic for the market. A rally with a high put/call ratio would tell us folks do not trust the rally and that would be a change.
And if there is no follow-through from Friday’s action? Considering we are still short-term oversold that would be bearish.
My view from the first trading day of 2025 has been this is a trading market, and that view has not changed. Don’t get comfortable on either side of the market.
New Ideas
I’m going to do some requested follow-ups today.
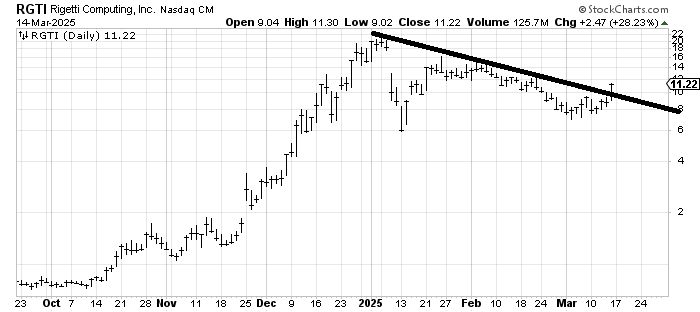
Rigetti Computing RGTI flew last week, and while it got over 10, it now has resistance all the way up. My inclination is that it has more room to move up, but I would put a stop in under 10 (it seems far away, but those are the numbers). I do not have a measured target yet, and we know I am terrible at chasing.
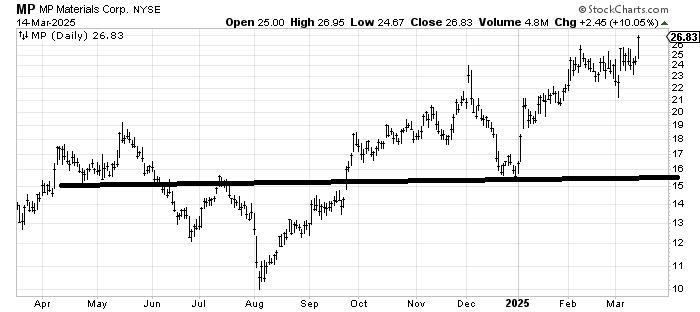
MP Materials MP has been consolidating for months now. The original measured target was in the 28-30 area and still measures there although there is another measured target near 32. In this market, let’s see if it can get to 28-30 first.
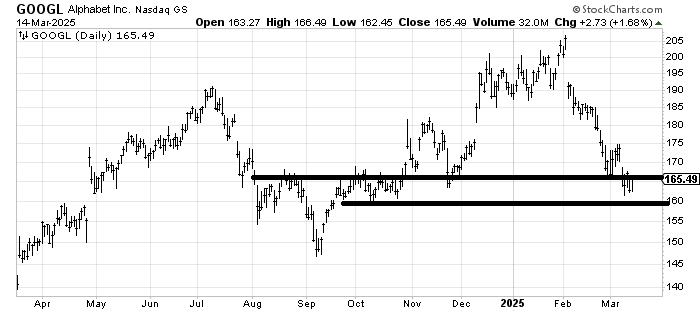
Alphabet GOOGL has not budged since I wrote it up last week. I would have liked to see it gap up over 170, leaving this area down here as an island, but thus far, that has not come to pass. I remain positive on the chart, especially if it can gap up over 170.
Today’s Indicator
The Hi-Lo Indicator is discussed above
Q&A/Reader’s Feedback
Helene welcomes your questions about Top Stocks and her charting strategy and techniques. Please send an email directly to Helene with your questions. However, please remember that TheStreet.com Top Stocks is not intended to provide personalized investment advice. Email Helene here.
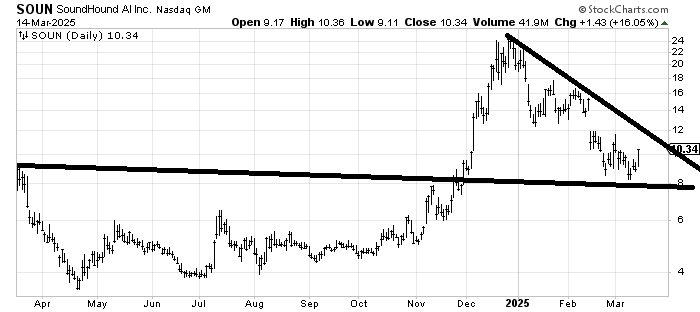
SoundHound SOUN should rally toward that line/resistance around 12. I don’t know if it has done enough work down here to fill that gap at 14 yet.
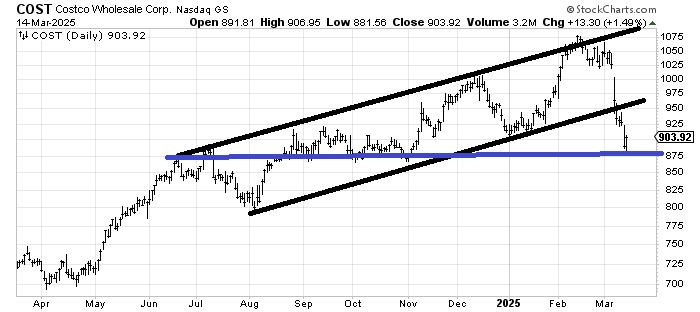
When we last checked in on Costco COST it was near the top of that channel, and I thought it ought to come down to the lower end. It blew right through the lower end, but 875 is decent support. For the time being, rallies to that 925-950 area should be sold. Remember, it's a trading market.
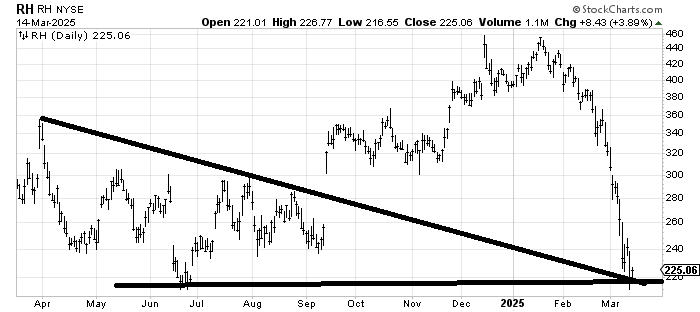
RH RH bounced off the prior lows, and any stock that goes halves in a matter of weeks is oversold. Right now, that’s the best I can say about the chart. 240 is first resistance.
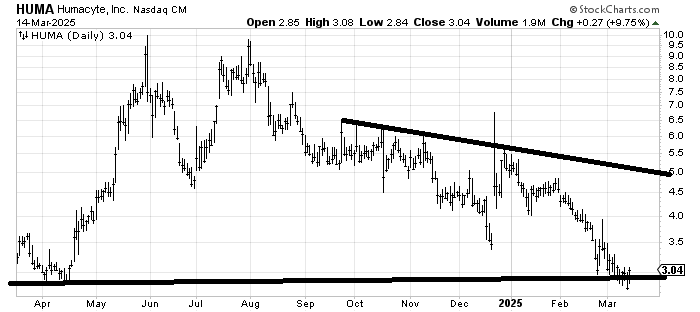
Humacyte HUMA trades so thinly (see all those spikes?) that it’s hard to be dogmatic about its direction, but at least it has support down here. 3.50 is first resistance. 4 is much tougher.
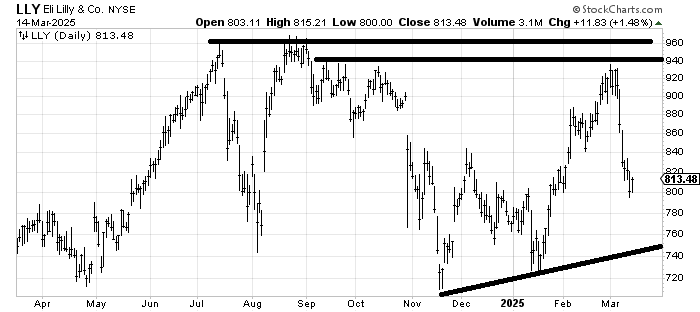
Eli Lilly LLY is in the middle of nowhere. It has some light support here, but I would need to see more proof that it wants to rally for more than a few days to get excited about it. My guess is it bounces and comes back down.
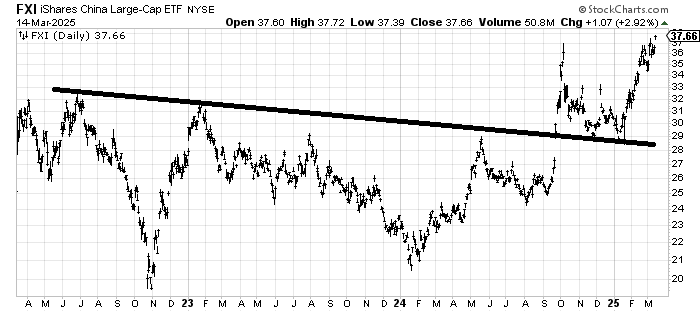
I am using a three-year chart of FXI because, in the near term, it is up so much and over-extended. It has a measured target near 41 in the near term. Intermediate term, I can measure something in the mid-40s.
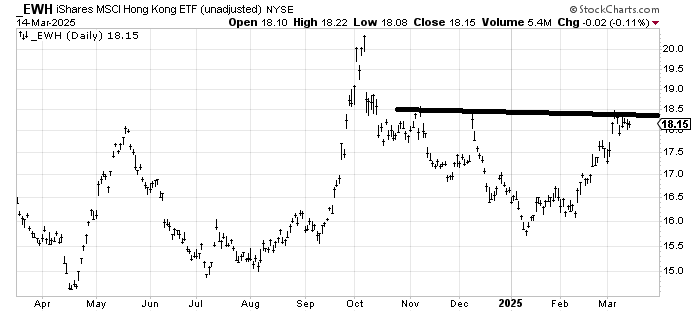
I would rather watch EWH (Hong Kong) for a move over 18.50.