The Market Was Up, but Stocks Feel Lethargic
It's hard to find stocks that are peeking through resistance and ready to rally.
You've reached your free article limit
You've read 0 of 1 free Pro articles.
The Market
Typically, after an up day such as we’ve had, I will have a list of charts that I like. I mean, I will go through my pile of charts, put the pencil to the paper, and I ought to see lots of stocks that are peeking through, stocks that look like they have done enough work to want to lift.
I don’t really see that. Over the last few weeks, I have seen a handful here and there, but even those are pretty lethargic. Take Meta (META) , for example. Sure, it’s rallied since that reversal two weeks ago. But the last few days, it has tried its hardest to get over 740 and can’t do it. And the stock closed up a buck and change today. That’s it.
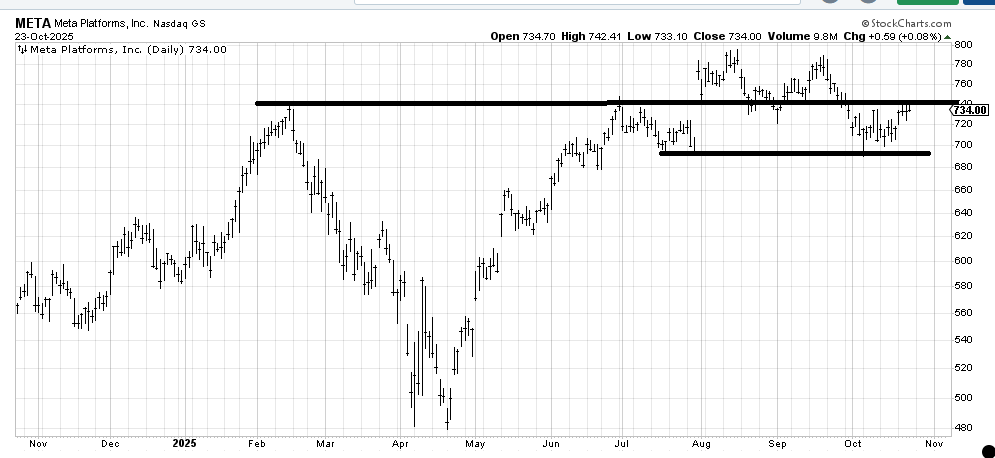
It has earnings on Wednesday, so I’d like to see it over this area before earnings, to give me the confidence that if earnings aren’t good enough, there is some cushion for a retest of the recent lows. But anyway, that’s what I mean: today’s market had lethargy.
Nasdaq had its second-lowest volume of the week, with Monday (discussed here Monday evening) the lowest of the week.
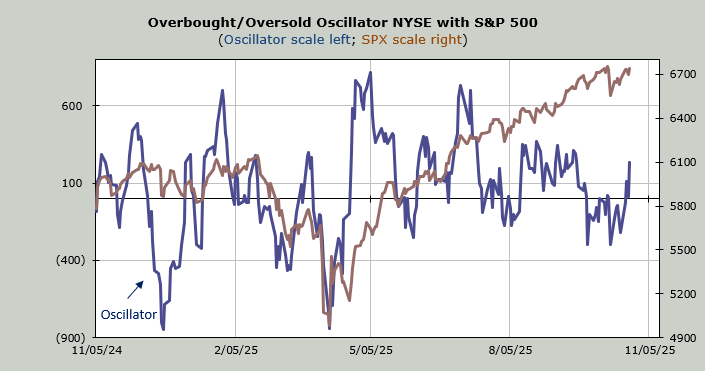
The Transports were red (oil?), the Utes were red, the Bank Index was red. Today was an energy and rebound in what has been down. That’s it. Breadth was okay, not great. And using my Overbought/Oversold Oscillator, we’ll be back to a short-term overbought condition early next week.
New Ideas
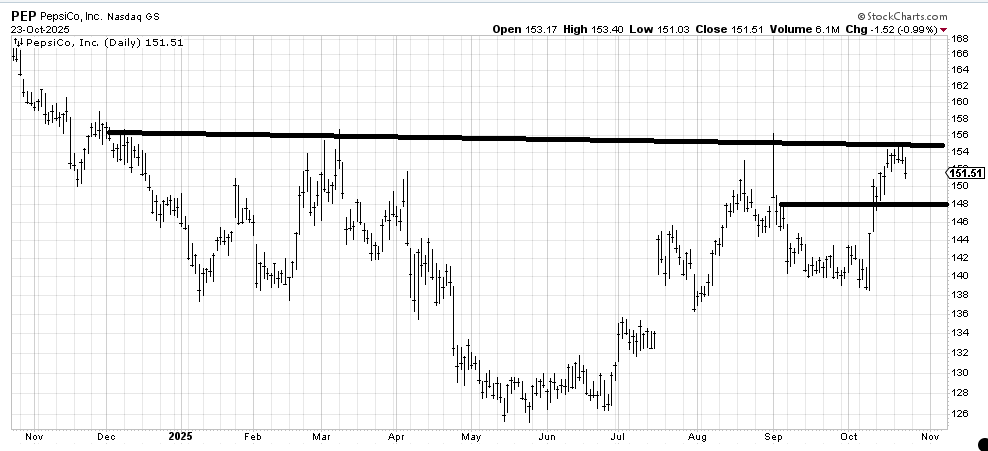
As a follow-up, Pepsi (PEP) stalled out and is now pulling back. I would not be surprised if it came down to that 148 area. I would prefer if it would do so gradually. Of course, Pepsi doesn’t seem to do anything gradually!
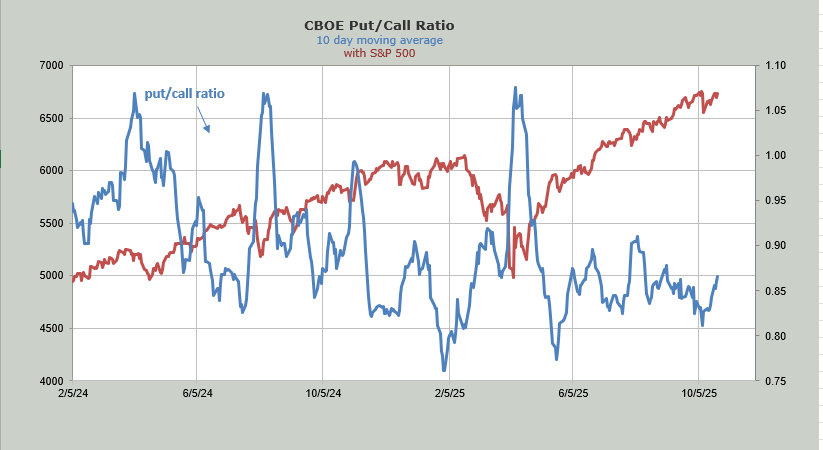
Today’s Indicator
The 10-day moving average of the put/call ratio has been rising. It is almost back to where it was in mid-August.
Q&A/Reader’s Feedback
Helene welcomes your questions about Top Stocks and her charting strategy and techniques. Please send an email directly to Helene with your questions. However, please remember that TheStreet.com Top Stocks is not intended to provide personalized investment advice. Email Helene here.
I want to make a note that nearly all the stocks listed here today have earnings in the next week (some are in a few weeks). It is not my style to ‘play’ earnings. They are a wildcard to me. Good charts can turn ugly on earnings, and bad charts can turn good.
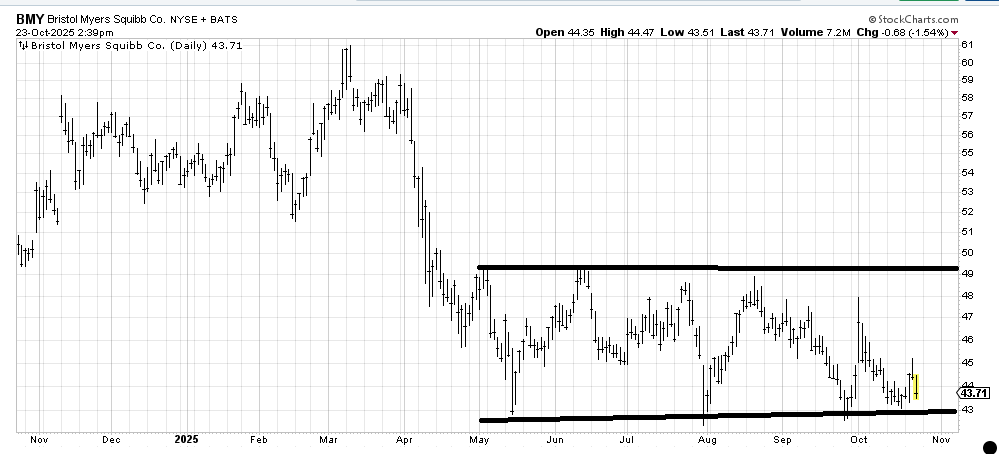
I have suffered with Bristol Myers (BMY) for a long time. It doesn’t trade well, yet I keep thinking this is a bottom in the making. Should the stock break 40, like it means it I will give up on it because the next target is in the low 30s.
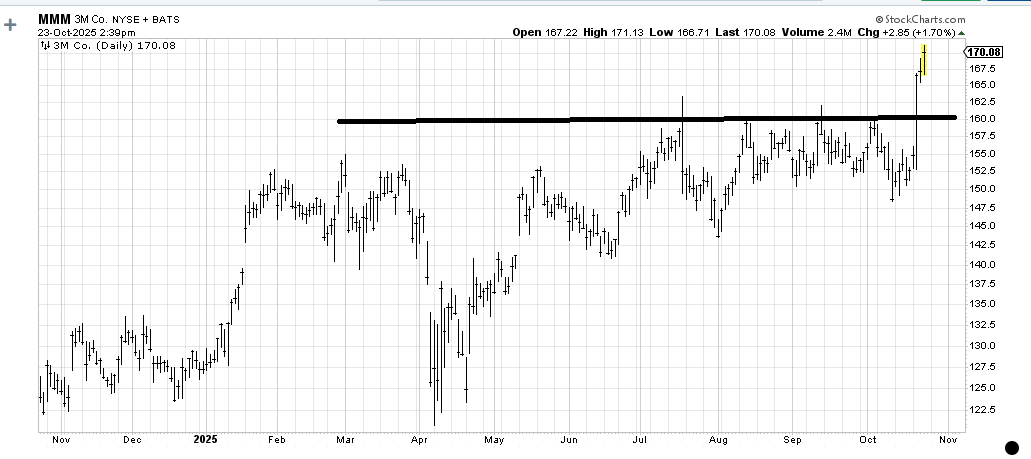
I recommended 3M (MMM) back in July, and the stock did absolutely nothing for the next four months. Now it has finally broken out, and there is a short-term measured target right here around 170 and a longer-term one near 200.
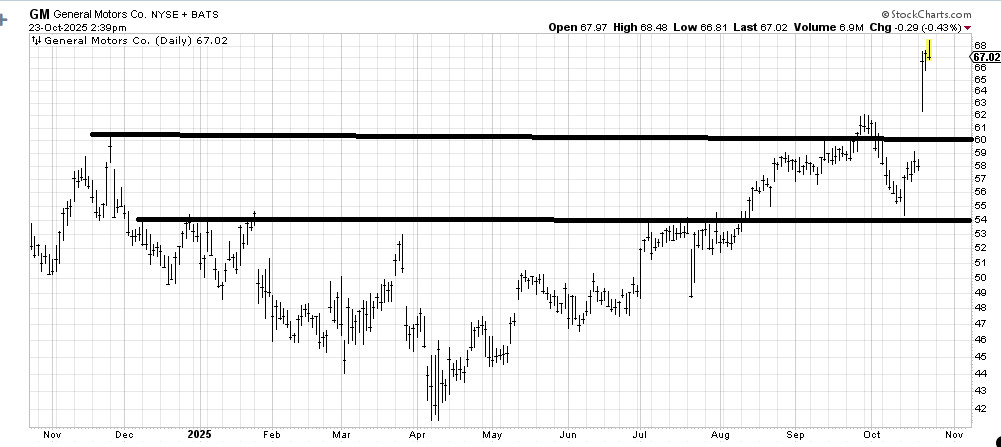
General Motors (GM) has a measured target around here (66), and then there is another one, much longer term, near 80, but I would not chase it up right now. I would consider taking some profits here and then waiting for another pattern to set up.
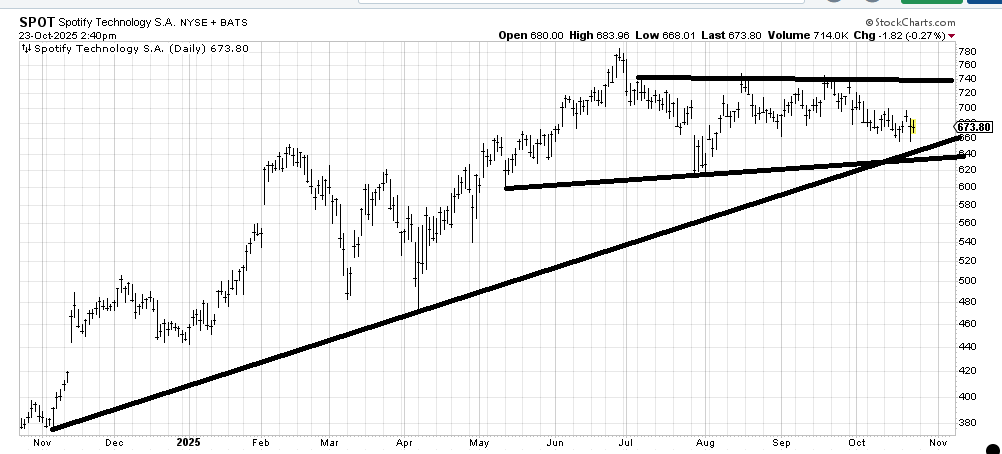
I can see Spotify (SPOT) coming down to tag that lower line (630-640 just as easily as I can see it rallying to 740. And it would probably do it on earnings. If it plunged, I would want to see if it holds that support because if it does, it’s likely it would be buyable. Why? Because the stock has done an awful lot of work since its peak in June. If it breaks, it leaves a top overhead.
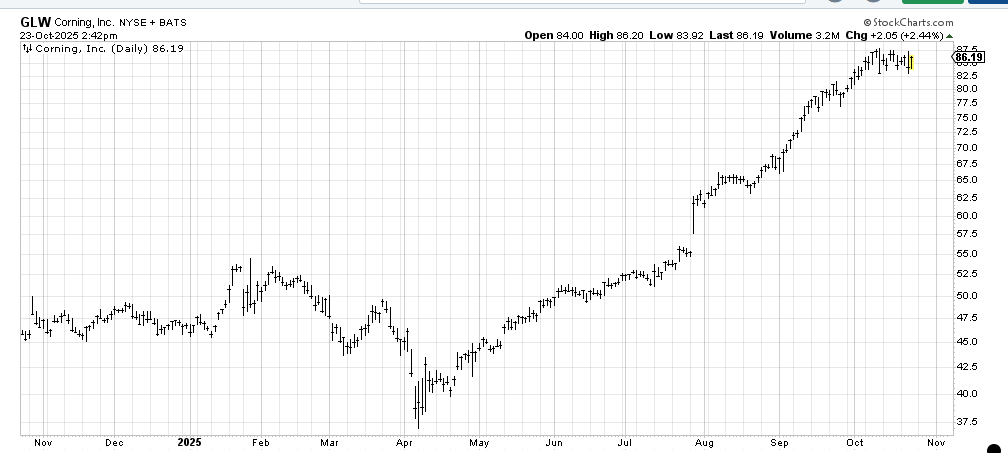
We looked at Corning (GLW) recently, and it’s not my kind of chart. It’s up too much, and there is no support to speak of close by. If it breaks 82, I’d get concerned.
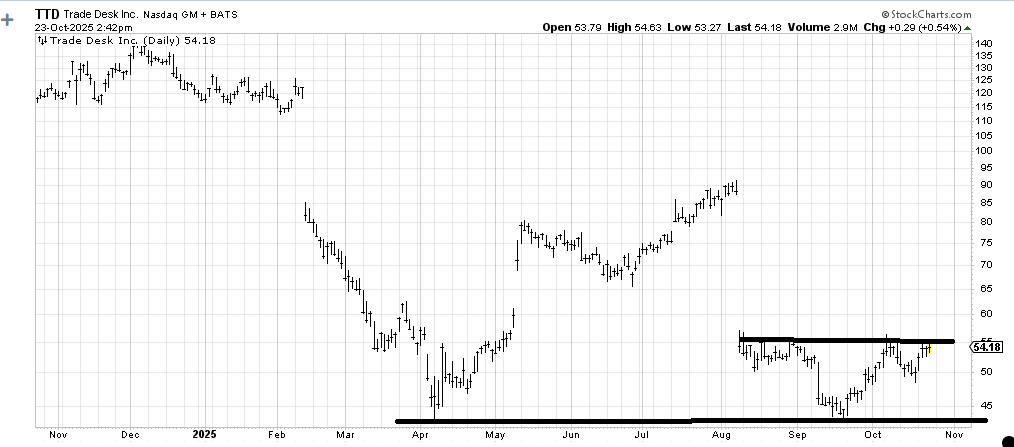
Trade Desk (TTD) is trying to complete that head and shoulders bottom. But notice that when it got down under 45, it was testing the April low, something I like. I wouldn’t know where to put a stop, but if it crosses over this neckline, I think it is going to 65, which is where that bottom measures to, and where first resistance is.
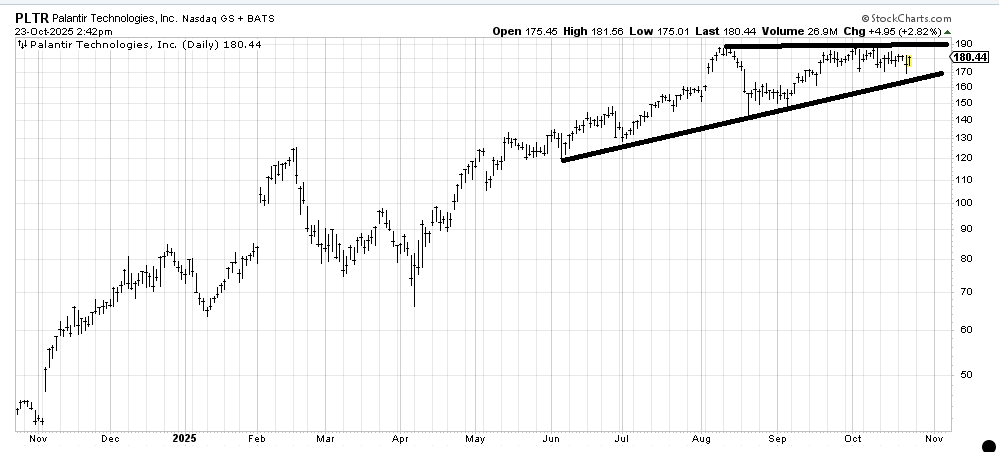
Palantir (PLTR) is trying to set up a new pattern, but with earnings next week, we all know it will do it on earnings. For now, I’ll just say that it really needs to hold 170, and a breakout over 190 would measure into the 240 area.
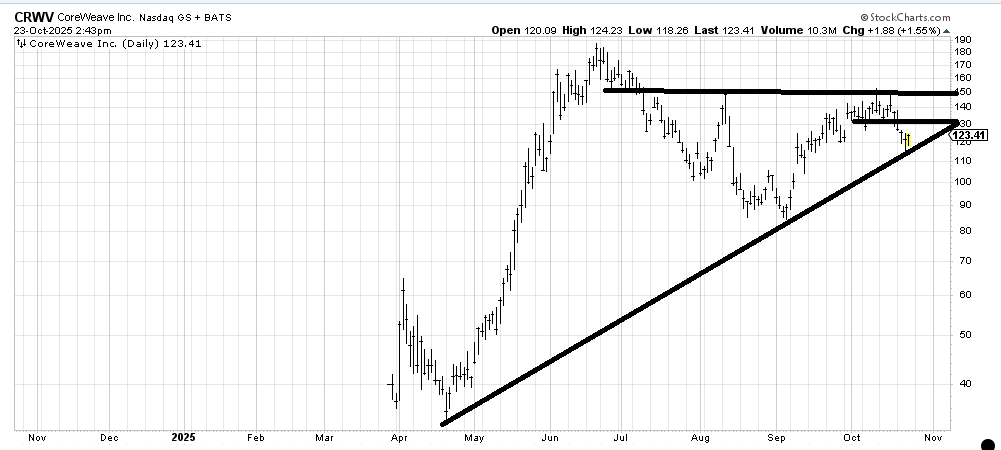
We had a nice trade in CoreWeave (CRWV) in September, and now the only thing I see is that it is oversold enough to bounce off this line, but the chart still feels unsteady. If it can’t get over 180 I would think the next trip down that uptrend line breaks.
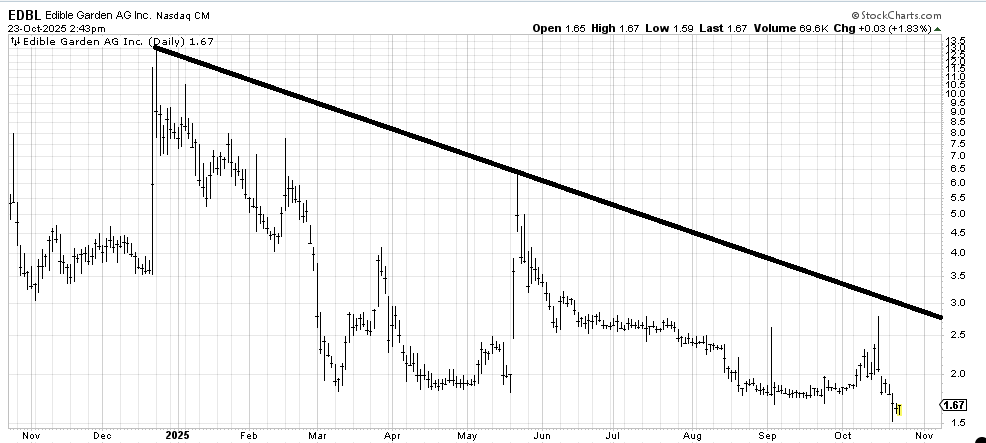
I look at the chart of Edible Garden (EDBL) and I think so it rallies, big deal. Why? Because every rally seems to last a day or two before the downtrend gets back on track. Until that pattern ends, that’s all I see.
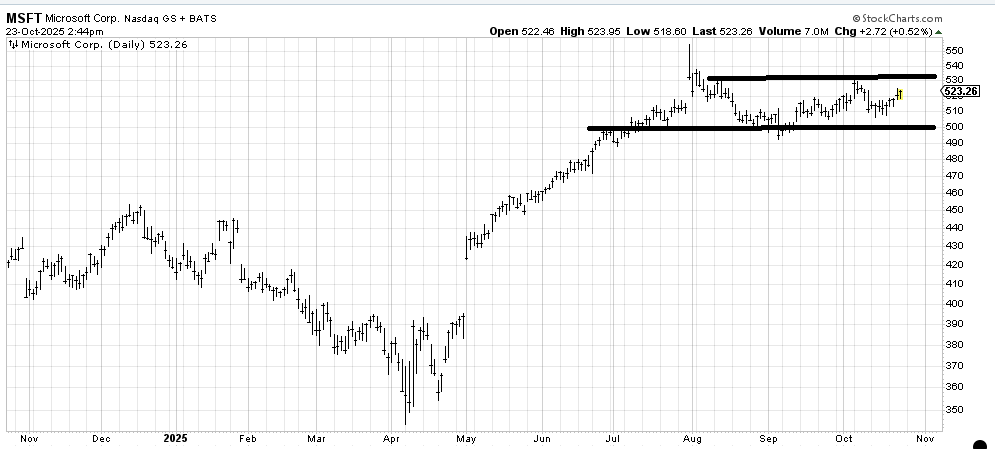
Back in early September, when Microsoft (MSFT) got down near 500, I said as long as it holds this 500 area, the stock should be okay. It’s not been great since rallying off that area but it’s held. I would say that same thing today: as long as 500-ish holds, the stock looks like it’s just consolidating its gains. If it didn’t have earnings next week, I would be happy to take a stab at it, but with earnings a few days away, I’ll wait on the sidelines. If I owned it, I would hold it.