The Market Decline Has Not Run Its Course
Most didn't notice, but stocks' downward path didn't just start last week. Let's see how things are likely to play out, where index support is, a semi that looks like a drug stock, and much more.
You've reached your free article limit
You've read 0 of 1 free Pro articles.
The Market
I can give you all sorts of reasons that we should rally in the short term, but it still seems to me that this decline has not yet run its course.
Let’s start with why I think by late this week we’ll be short-term oversold. This decline did not start in the last few days. It began just after July 4th. That’s when the majority of stocks stopped going up. That’s when we got that DSI for the S&P 500 at 87. That means we are essentially 3+ weeks into the decline, but most folks only noticed it last week when the indexes started pulling down.
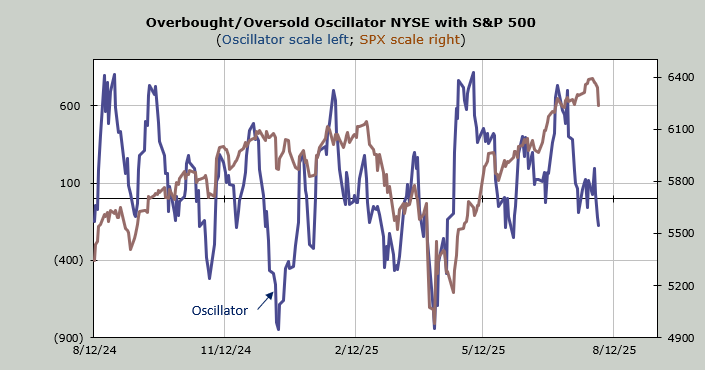
Just take a look at my Overbought/Oversold Oscillator. It is well under the zero line and closing in on where it was in early June. One interpretation is that’s how weak the market has been (remember this is based on breadth), because that recent peak you see was that early July period and we’ve been losing momentum ever since.
For the last seven trading days breadth has been negative four days. One of the days it was positive by a mere 40 issues. So for argument sake let’s say breadth has been persistently weak for six of the last seven trading days, thus meaning that by midweek this coming week the market will be short-term oversold.
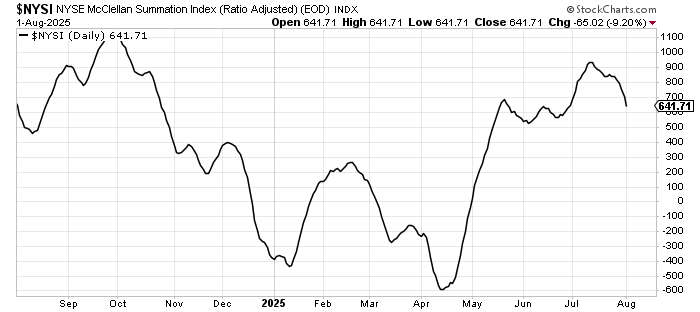
Then there is what it will take to turn the McClellan Summation Index from the current down to halting the decline. Again, on this chart of the Summation Index you can see the decline didn’t just start last week but began in early July. It currently needs a net differential of +3,300 advancers minus decliners on the NYSE to halt the decline. That makes it moderately oversold; at +4,000 we’re oversold. Thus, if the selling continues into midweek it ought to get to +4,000 or more.
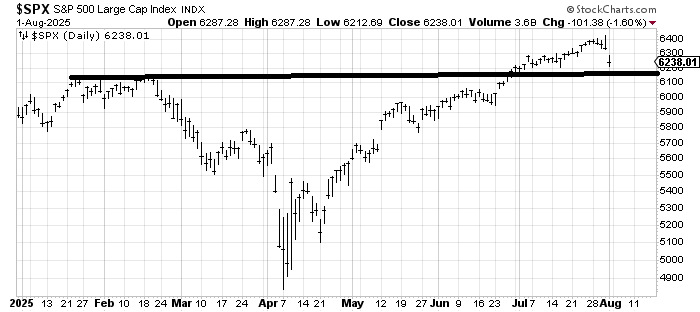
I can also show you that the S&P has support in this 6150-6200 area. The Dow has support around 43,000, the Transports at 15,000, The IWM around $213-215 (recall that was a decent resistance area on the way up), the QQQs at $550 and the Nasdaq at 20,000.
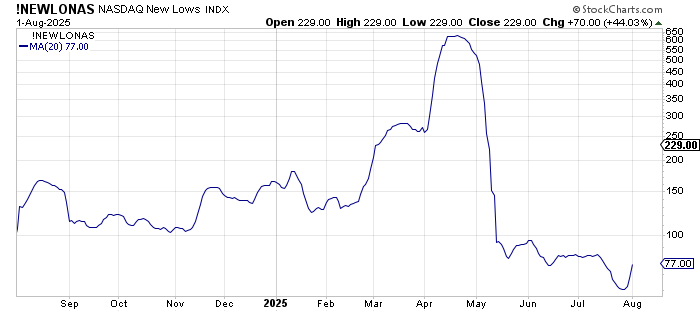
So why do I think even if we rally short term the decline has not yet run its course? Because we continue to see an expansion in stocks making new lows (a contraction is the first sign the selling is exhausted).
Recently, I showed you how the 10-day moving average of stocks making new lows had turned up but not yet the 20-day moving average. Now the 20 DMA has joined it. Friday saw nearly 100 stocks making new lows on the NYSE (over 200 on the Nasdaq), the most since April. That raw data needs to contract before the moving average can peak.
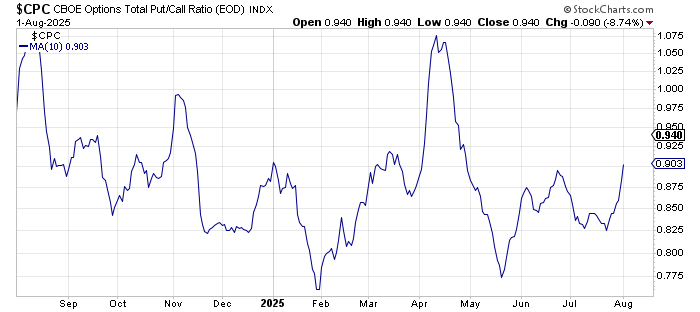
The last two days the equity put/call ratio starting climbing, with Thursday’s reading at 0.84 and Friday's at 0.75. But let’s look at the 10 DMA of the total put/call ratio. It’s finally on the move upward, now clocking in around 0.90. Generally speaking once it gets over 0.95 it tells me there has been a sentiment shift and folks have gotten cautious.
Finally the intermediate-term indicators are nowhere close to being oversold.
So I do think we’re getting a little oversold (IWM has been red for five straight days) in the short term, but it seems to me we still need to see the decline run its course and I don’t think it has.
New Ideas
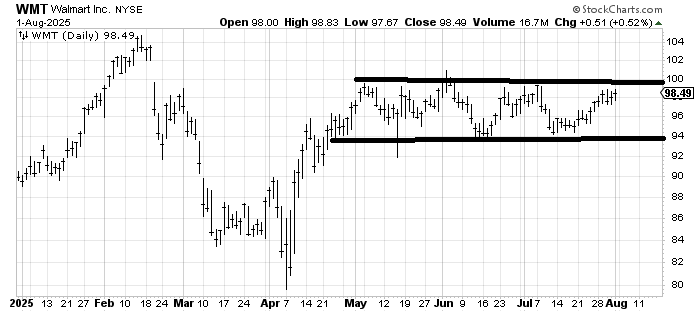
Since May I have been of the mind that Walmart WMT was in a trading range between $94-100. Shockingly, that is exactly what it has done. In the last few weeks WMT has seen no selling. If WMT holds over $97 it could break out over $100 when we get oversold again. Under $97 and the range continues.
Today’s Indicator
The new lows are discussed above.
Q&A/Reader’s Feedback
Helene welcomes your questions about Top Stocks and her charting strategy and techniques. Please send an email directly to Helene with your questions. However, please remember that TheStreet.com Top Stocks is not intended to provide personalized investment advice. Email Helene here.
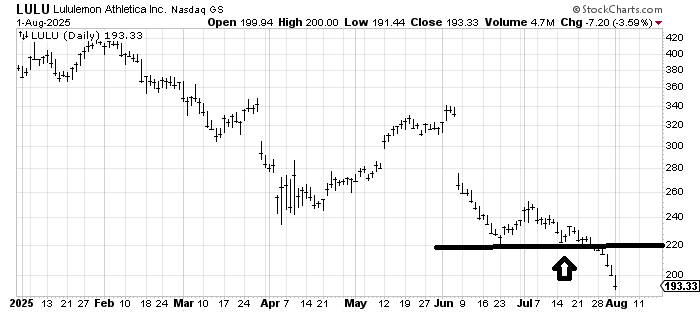
Lululemon LULU has been in a downtrend for more than a year, but you can see the acceleration that took it down starting in early July. I thought it would bounce when it got to that arrow but you can see the bounce was rather pathetic and now it has broken. Last week’s slide has probably taken the stock to an oversold condition. If you want to play for a oversold bounce I would expect one to show up this week. But right now that’s the best I can see here.
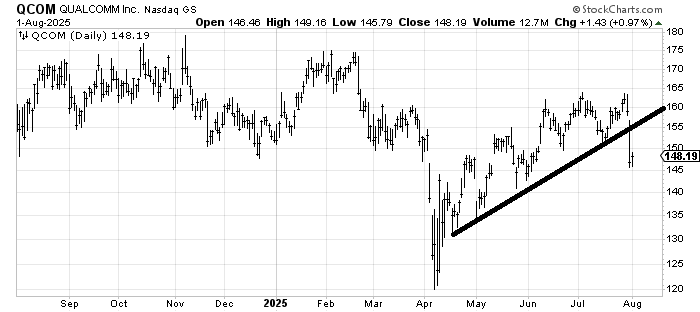
When you look at the chart of Qualcomm QCOM you’d never know it was a semiconductor stock; it looks more like a drug stock. It’s got support levels all the way down but if it rallies back near $155 in the near term I think I’d be inclined to sell it.
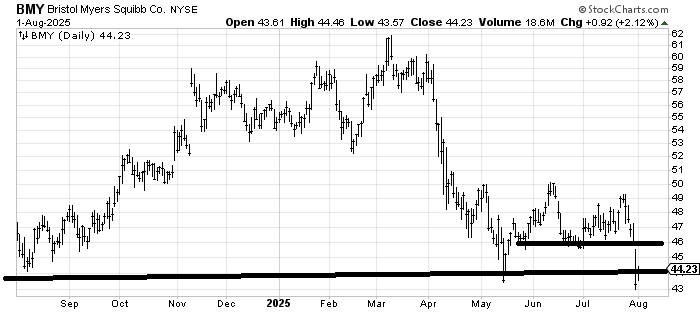
I did not expect Bristol-Myers Squibb BMY could have more sellers in it but it managed to break $46 rather handily last week. It’s now oversold enough to rally. Was Thursday a test of the May low (my view: spike lows tend to hold the first trip down) or just a way station? If the stock can get back over $46, it is the former, if it cannot, it is the latter.
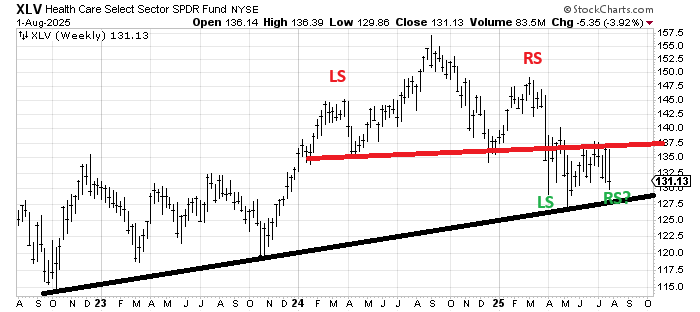
I was asked about the potential head-and-shoulders bottom on the daily chart of the Health Care Select Sector SPDR Fund XLV (green). But I was also asked about the potential head-and-shoulders top on the chart of XLV (red).
I’ve been eying (wrongly so far) the bottom. If I am correct, then the bottom should not break $125-ish. If I am wrong and that area breaks, then the measured target is down near (long term) $115-ish, which was the October 2022 (bear market) low. It’s a struggle; you know which side I reside on, but those are the parameters.