The Insiders Have Started to Get Out
It's shaping up to be a busy week with the FOMC meeting and index movers' earnings.
You've reached your free article limit
You've read 0 of 1 free Pro articles.
The Market
Friday’s action didn’t change my view on the market very much. I still think we should get a bout of volatility this week as we are getting short-term overbought. I also still think this year is more apt to be a trading market than a one-way street.
This coming week will bring us the FOMC Meeting and the Index movers’ earnings reports. I have no strong views on the Index Movers because, as I have noted, most of them haven’t done a whole heck of a lot in the last few weeks and so when we have looked at them, I have posted what are the measured targets and that’s that.
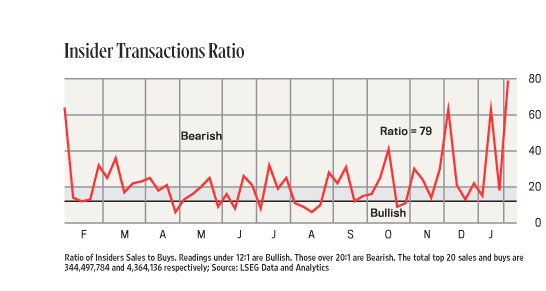
What did change in terms of the indicators is that the Insider Selling has picked up quite a bit again. Keep in mind that if you try and line this chart up with the S&P or even the Russell 2000, you will see very little correlation. But it is there.
Last year, we saw that big spike in selling in January (it has now fallen off the chart), and most excused it as ‘Zuck is selling,’ so no big deal. But then I explained that the majority of stocks went on to make a high in February and March. Recall how many charts we looked at that did just that and then went sideways to down until this summer/fall.
What we have now is not one spike, not two, but now three spikes, all coming in the last two months. That is just another reason I don’t think this year’s market is going to be a one way street and is more apt to give us a lot of swings.
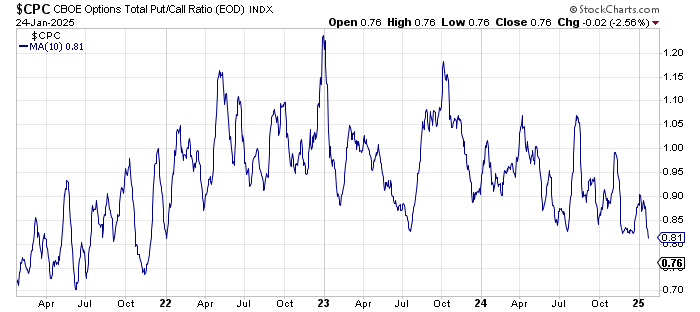
The other chart that changed is the ten day moving average of the put/call ratio. Last week I said I thought it had to come down more. And now it has. It is now at .81 which is the lowest since January 2022. So now I think this is problematic in terms of sentiment. It can and may go lower but now we’re heading into ‘too many calls’ territory.
New Ideas
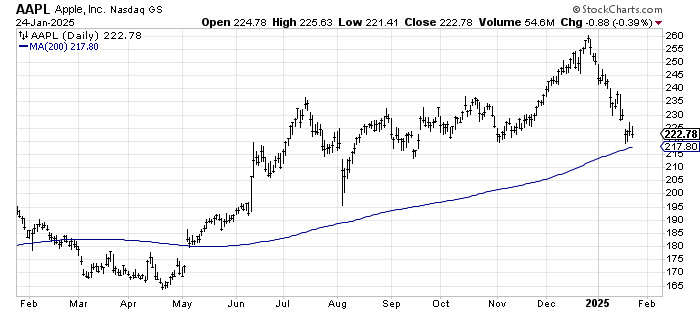
Let me discuss Apple’s AAPL chart today. What you can see is that this 220 area was the prior low in early November and it also happens to be where the 200 day moving average line is. Then there is the September low around 215.
Do you see how September gapped down and back up, leaving an island down there? Unless Apple gaps up over 230, leaving last week’s action as an island I am not a buyer. The alternative is that Apple gaps lower under the 200 dma and we have some hysteria over it and that spike low from August contains the spill. Then I would probably buy it for a trade only.
A rally from here with no gaps up that can’t get over 235 is going to make this look like a big head and shoulders top with a neckline around 220.
That’s a lot of scenarios on how to play it. At this moment in time I do not see a trade to take with confidence. If it plays out one of the three scenarios I have noted above, then I see the trade cited.
Today’s Indicator
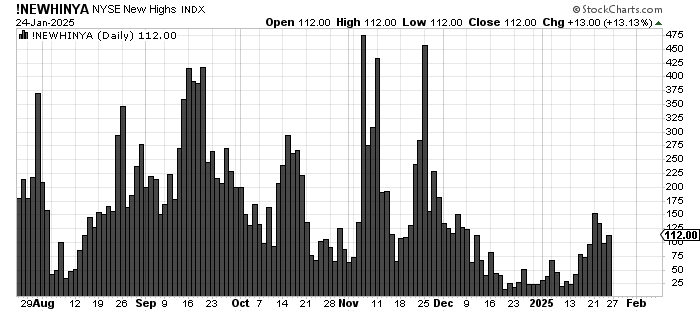
The number of stocks making new highs has lagged in the rally. The Hi-Lo Indicator however, has not yet rolled over.
Q&A/Reader’s Feedback
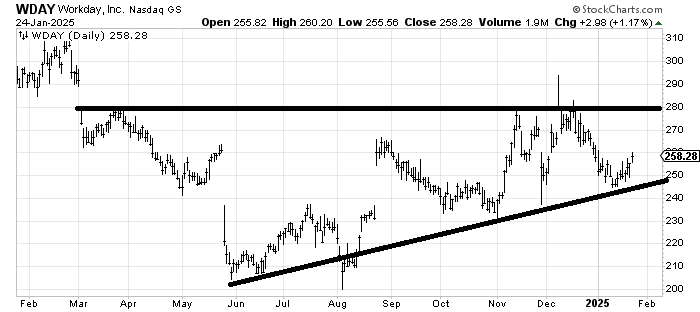
Workday WDAY looks like it is trying to bottom/base. The near term looks a bit murky to me since there is resistance from 260-280. But as long as it stays over 240 the chart looks interesting to me.
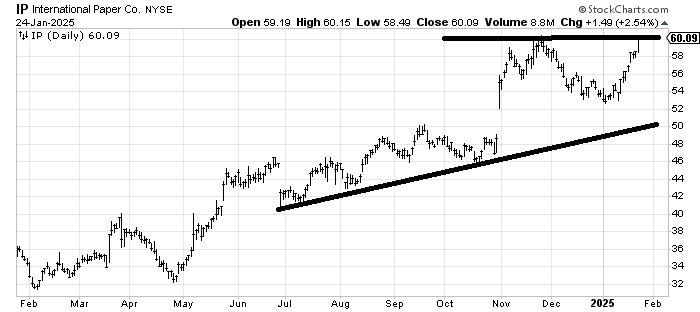
International Paper IP hasn’t done anything wrong but with earnings coming up this week and the stock looking over-extended and at some resistance I would be inclined to take some profits on a trading basis.
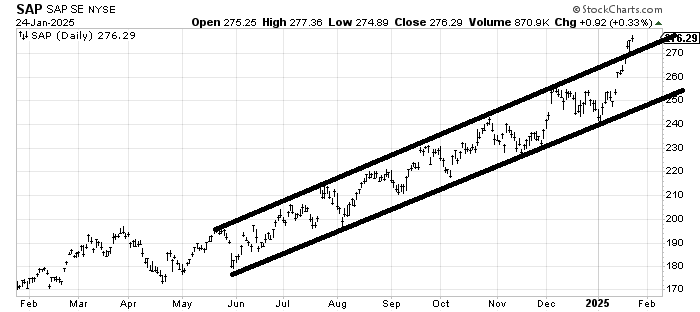
SAP SAP has lifted out of the channel it has been in since June. That makes it over-extended in the short term but pullbacks toward 270 (the upper line) should hold therefore while it is not my style to buy stocks up so much pullbacks to the line should be buyable since the risk/reward would be good. If it goes back under the line, you are wrong and this was a false breakout.
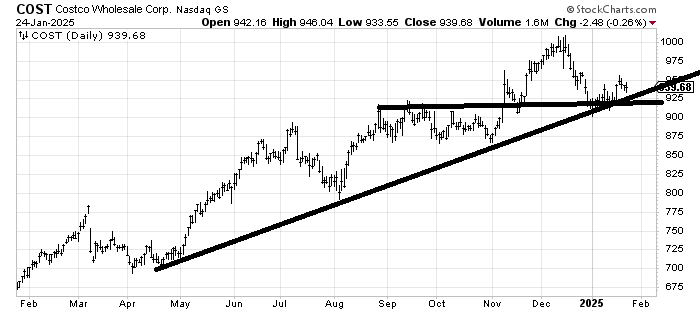
Costco COST could be forming a head and shoulders top so I would use a stop under that 900-925 area since that would break the recent low and the uptrend line as well as complete the top.
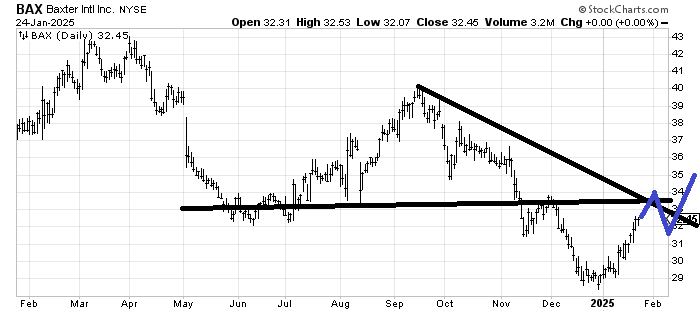
Baxter BAX is getting over-extended short term and heading into resistance. If it can get up to that 33-34 area, pullback to the 31-32 area and then head up again I would at least start to see the semblance of a bottom being made. Otherwise it hasn’t made a higher high since September. That needs to change.
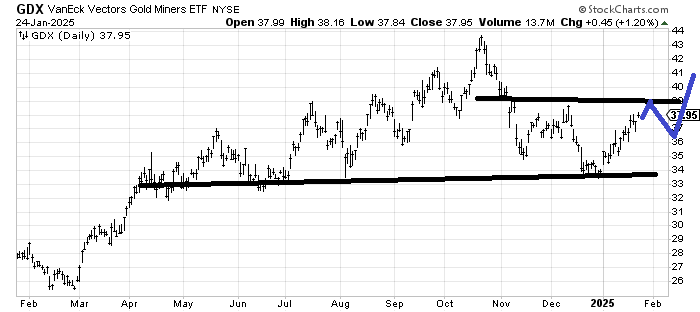
GDX an etf to be long gold stocks has not fared nearly as well as gold itself which is closing in on the autumn high. GLD’s DSI is 76 so the runway will get short if it rallies much more. I’d prefer to see it map out as I have drawn in blue so I’m not a fan of chasing it here since I think another buck or so stalls out the rally.
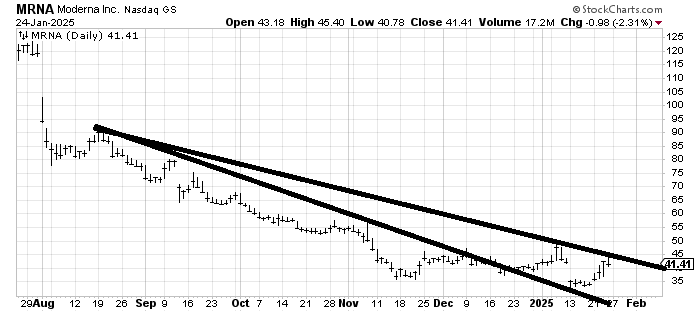
As someone who likes to bottom fish Moderna MRNA is a chart that catches my eye. Yet it hasn’t made a higher high or a higher low yet so until it does so all you get from the chart is small rallies that fail. If the stock can cross 50 then I would be interested in believing there is more to the chart than a trade.