The Indicators Grind On While the S&P 500 Grinds Upward
Let's look at some key segments of the market.
You've reached your free article limit
You've read 0 of 1 free Pro articles.
The Market
Gosh, I really wish the indicators would move. It’s been nearly two months of just grinding in them while the S&P grinds upward—six days in a row now, and so many stocks get rotated into and then out of.
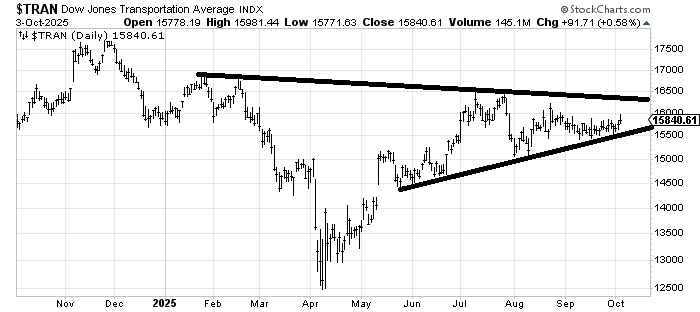
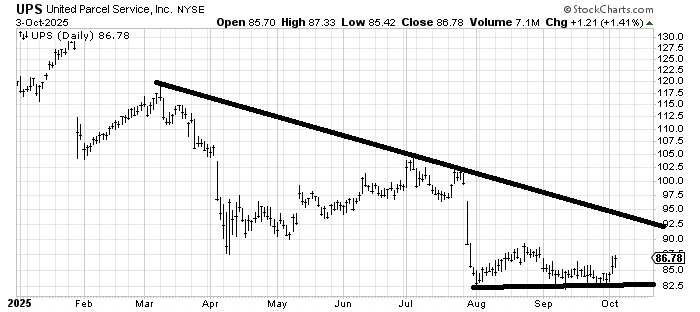
While I’m just trying to find the next group, they will rotate into (we finally got the drugs going last week), I would note that XME and LIT keep on going. The Transports managed to lift last week, but they remain lackluster despite my egging them on. We know they are just running in every short when even UPS finally gets going.
There were no major changes in the last two days, but the VIX was green every day last week. Oh, some days it was barely green, but I found it interesting that despite the relentless rise in the S&P, and it too was green every day last week, the VIX did not push lower. It hasn’t done that all year, and certainly hasn’t done that for the last two months of the relentless rise.
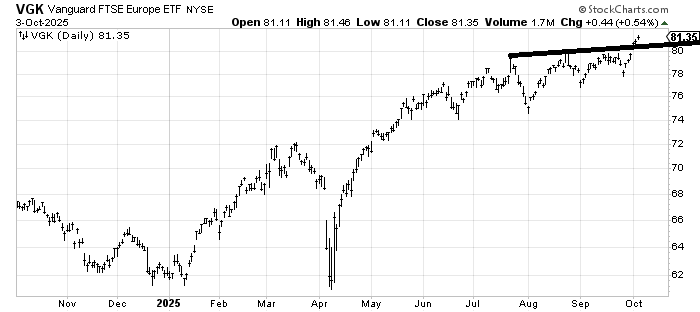
Another thing that occurred last week was (VGK) , which you may recall I first liked around Thanksgiving last year and had a target in the low 80s, finally got going again after nearly three months of sideways. The target is still somewhere in the 82-85 area. I just don’t want to see it back under 80 now.
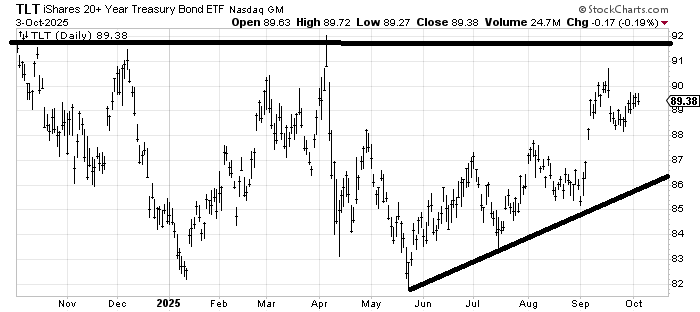
Finally, last week I thought (TLT) could lift to fill that gap near 89, this week I would remind you that I still do not think it is poised to breakout over 92, and now that the gap has been filled could easily come back down. Bonds remain in a trading range for now.
New Ideas
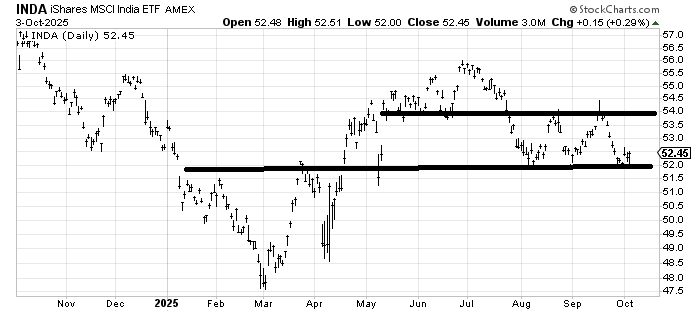
There is someone out there who used to ask about Indian ETFs, so I thought I would note that they have had quite a correction since July, but in the last two months, INDA has refused to break 52. I leave the possibility that there might be one more push down, but INDA is starting to get interesting again. I don’t want to see it much below 51, so the risk/reward is decent if you have some patience.
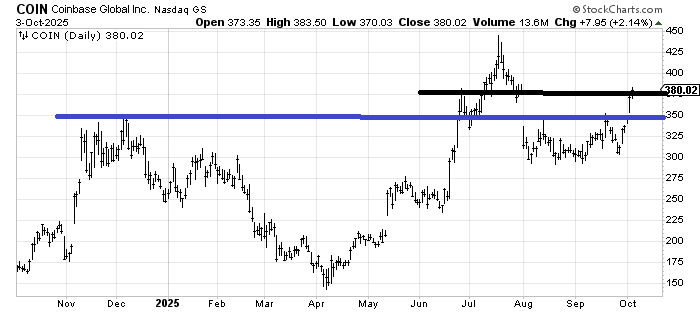
As a follow-up, Coinbase (COIN) , which I recommended in late August/early September, has finally filled that gap. If you are just trading it, you might want to take a little off. There is decent support back around 350-ish.
Today’s Indicator
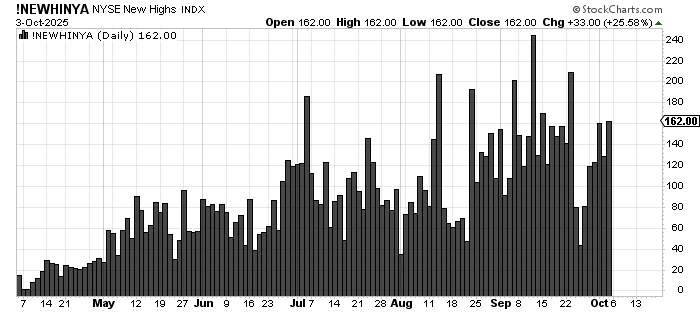
The new highs are still under that peak reading, but new lows have begun to contract.
Q&A/Reader’s Feedback
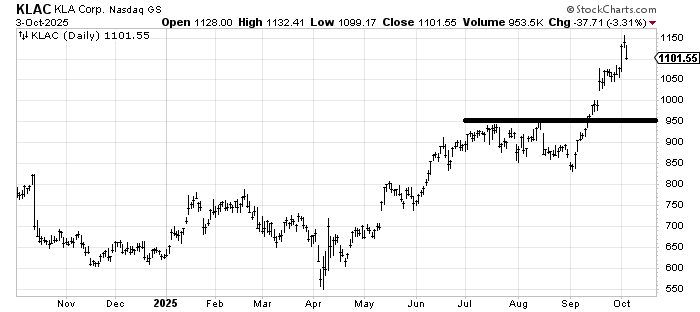
KLA (KLAC) hasn’t done anything wrong except get overextended, so it is in need of a correction. Coming down into that 950-1000 area would be great because it would test the breakout and fill that gap (at 1000), but if KLAC is coming down that much (10%+), then chances are the major indexes are finally going to correct.
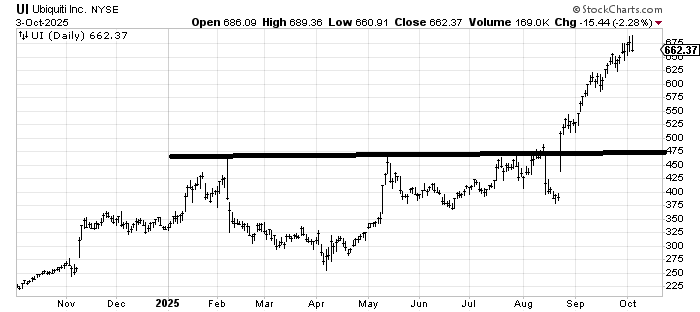
Ubiquiti (UI) is almost like a chart out of a textbook, having broken out of a long base on a gap and kept on going. But now it has reached its measured target, so I would be in favor of taking some profits here. It’s difficult to say there is support at any level because it hasn’t had much of a rest along the way. I would have to see a pattern shape up to say much more.
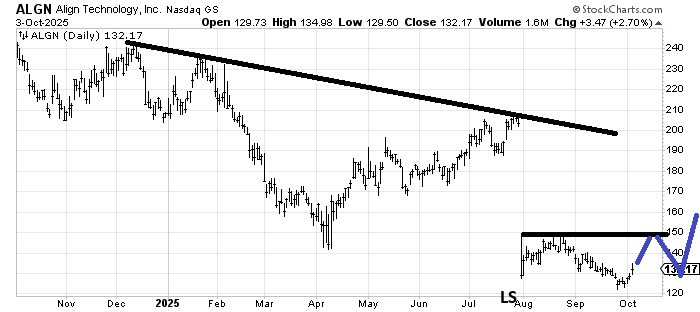
Is it possible that Align (ALGN) is forming a head and shoulders bottom with the left shoulder in August and the head the low in September? Time will tell. First, it ought to rally into that 150-ish area and then (maybe on tax loss selling?) come down into year-end to form the right shoulder. That might be getting ahead of myself, so let’s just start with a rally to that resistance.
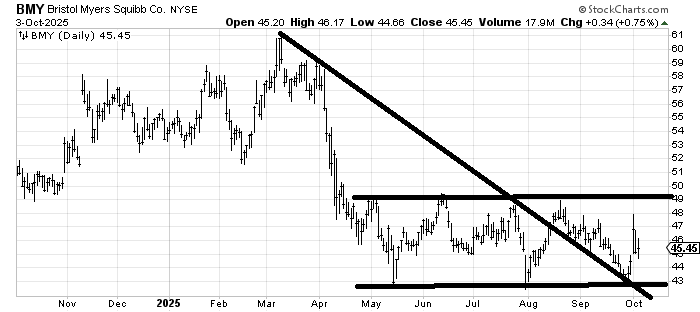
Bristol Myers (BMY) couldn’t even get over 49 on last week’s rush to cover shorts in drug stocks (yes, I believe a lot of the drug stock action was shorts rushing to cover). But it still looks like it’s basing to me. My patience is wearing thin, but that’s how it looks to me.
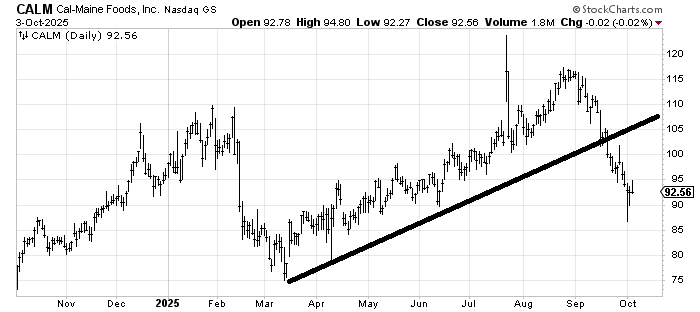
Cal-Maine (CALM) has a strong tendency to trade very spiky—notice the high in July or all the peaks late last year and early this year. That recent low looks like a cleanout. Not shown on the chart is a big spike in volume on that low near 86. I would guess it starts to settle down and attempt a rally in the next few weeks. The chart itself doesn’t look great to me, but if you want to trade it, I would lean to the upside after that whoosh last week.
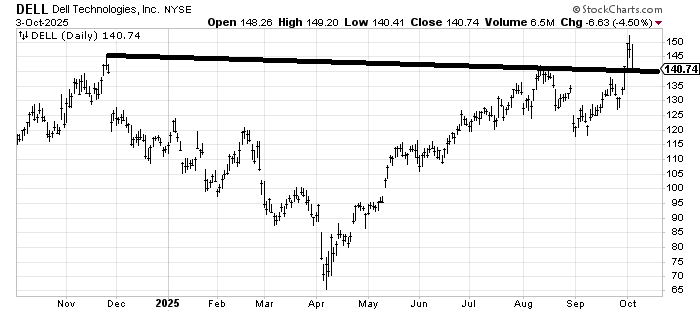
Dell Technologies (DELL) , which I think I didn’t like at 120, so perhaps you want to fade me on my views here, should try and hold here if it is going to be any good. If it comes down much more than this (call it under 135), this is going to look like a false breakout.
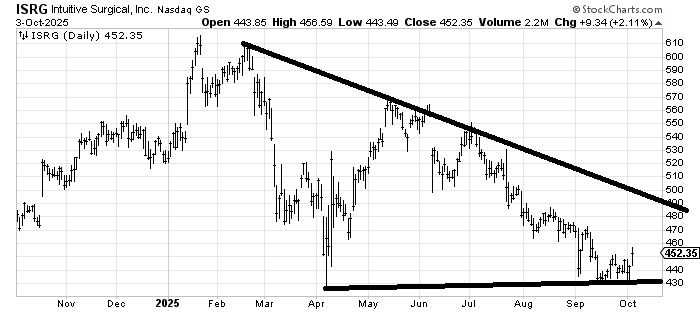
Intuitive Surgical (ISRG) is similar to the Target (TGT) chart I turned positive on recently. It’s come down to the April lows and begun to dig its heels in. There is resistance all the way up so it’s hard to say where it is going. The first serious resistance begins around 470. Maybe the shorts will have to run for cover here, too!
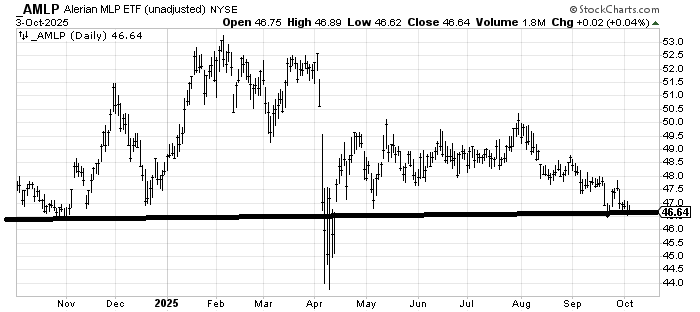
I would like to like (AMLP) an ETF to be long MLPs, but gosh, it is so droopy, with so little life. Yet this 46-ish area seems to have some decent support. Perhaps if it goes sideways for a while longer, I can warm up to it.
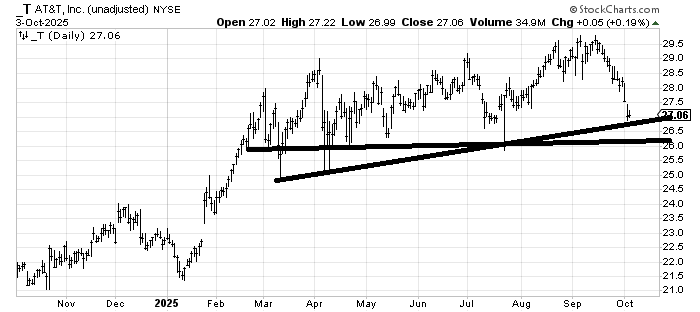
AT&T (T) has had quite a correction in the last few weeks. But it has plenty of support in the 26-27 area so I would expect it is getting oversold and should find some footing in this area.