The Index Movers Have Dominated. Is it Time for the Others to Lead?
Let's look at the ratio of an equally weighted S&P 500 to the market-cap-weighted version and see what could be next for stocks.
You've reached your free article limit
You've read 0 of 1 free Pro articles.
The Market
I made the comment yesterday that the breadth had made a new high, but the number of stocks making new highs was lacking since the NYSE only had 125 new highs. Today it had 119.
Today, I saw a few folks showing the chart of the RSP, an equal weight S&P relative to the S&P itself and I must say it exhibits what so many of the charts in my pile exhibits: the market indexes are really dominated by index moving stocks and despite the higher high in breadth, overall, there a lot of charts that have languished.
Would you think that the ratio of the RSP relative to the SPY would be sitting at the same low it was at in July of 2024? Or December 2024? Yes, I know both of these levels preceded a market pullback, but let’s step away from that for a minute.
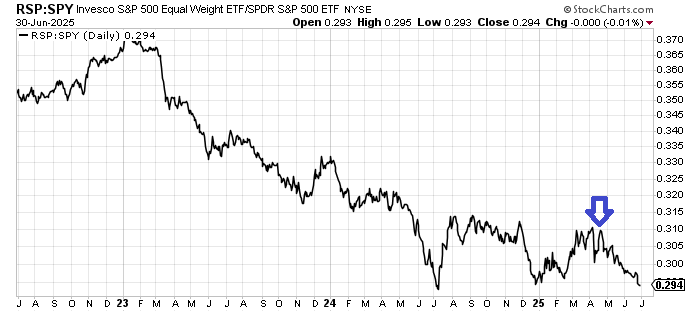
Let’s discuss instead the one-way street we’ve seen since the April low (arrow). So basically, when markets are a bit rocky, the RSP does better than the SPY. Maybe it’s the drugs, defensive stocks, homies, etc., that hold up better during a decline that gives us this.
I still like the drugs. I like Pepsi PEP (still), and maybe some of those defensive stocks are getting oversold. If we start to see them holding and turning upward, I’d say it’s likely this ratio turns upward too.
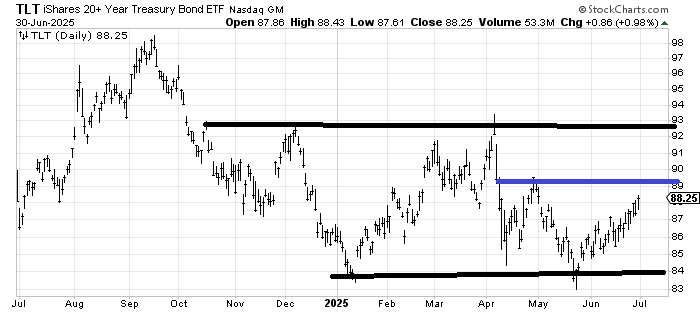
Notice that TLT, which I still think is okay even if it is heading toward some resistance near 89 (blue line) has been notching upward. We no longer hear folks concerned about the bonds. Maybe that means those groups mentioned above can get some traction.
Let me end by noting that the DSI for the S&P is 82. Nasdaq is 82. The VIX is now 20. So if we do rally into the holiday at the end of the week, this would/ought to line up for a move up in the VIX, down in the indexes, and up in that ratio.
The VIX for the Dollar Index is 17. So that too is still on my watch list for a rally despite how wrong I have been on it.
New Ideas
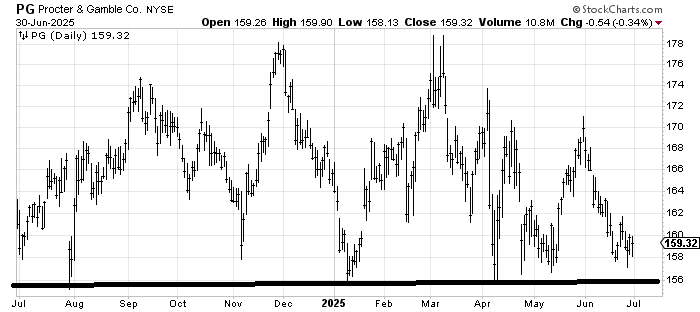
I have searched for new defensive names that are down and out, and it‘s hard to find interesting charts there. However, Procter and Gamble PG is down near support. This upper 150s area seems like a decent risk/reward for a trade.
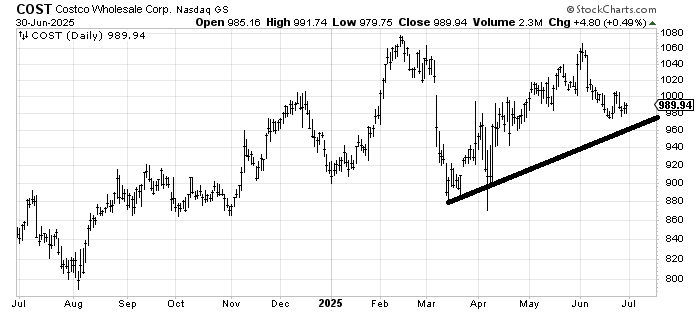
I promised to follow up when I thought Costco COST had come down enough. Somewhere between this area and 960, the chart will feel oversold again and should bounce.
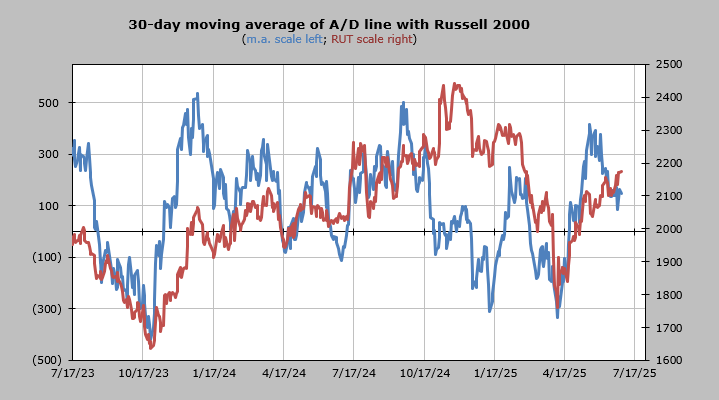
Today’s Indicator
The 30-day moving average of the advance/decline line is in the middle of nowhere. It is no longer overbought, but did not come down to an oversold condition either.
Q&A/Reader’s Feedback
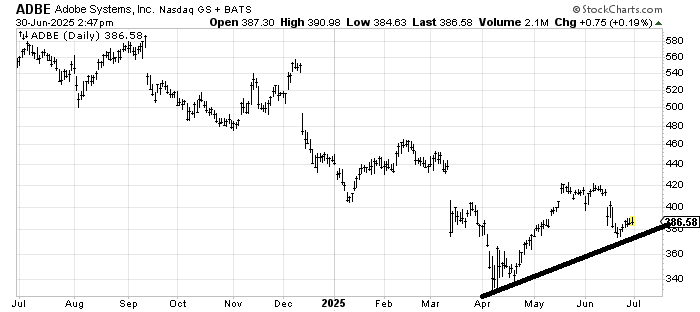
The fact that Adobe ADBE could not even fill that gap at 430 before heading down tells us what a weak stock it has been. That having been said, if it comes back down to that line (around 370), my best guess is that it holds and rallies, so the risk/reward would be decent if it gets back down to that line.
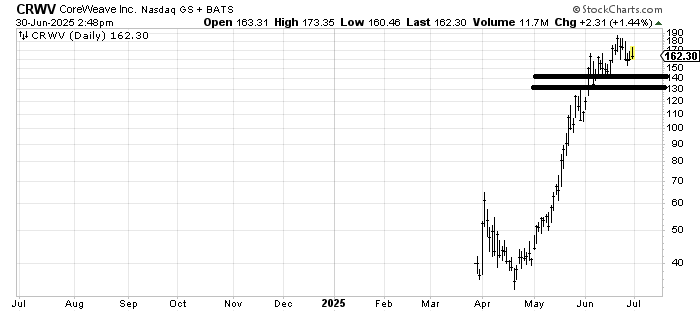
Coreweave CRWV does not have enough history for me to truly understand how it might trade going forward, but at this point, I would think a pullback to the 130-140 area would hold on the first trip down.
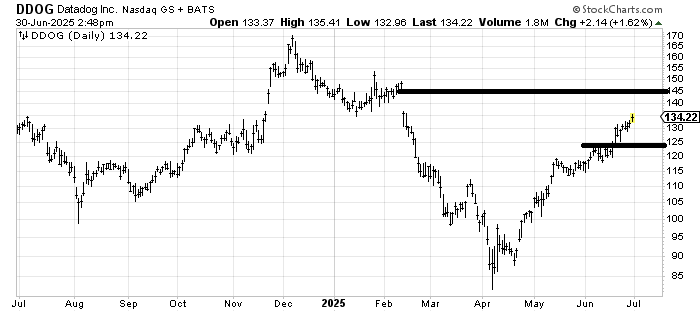
Datadog DDOG hasn’t done anything wrong yet. A pullback would be preferable (toward 125-ish), but I suspect it tries to fill that gap near 145.
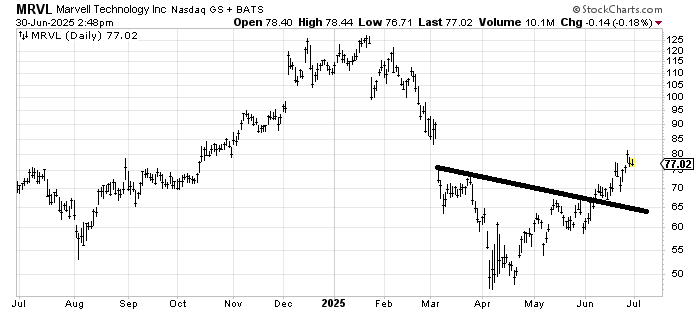
I believe we looked at Marvel MRVL with a positive eye, not long before I left on vacation. My view was that it should fill that gap near 85. My view hasn’t changed.
Helene welcomes your questions about Top Stocks and her charting strategy and techniques. Please send an email directly to Helene with your questions. However, please remember that TheStreet.com Top Stocks is not intended to provide personalized investment advice. Email Helene here.
