The Hitchhiker’s Guide to Trading Nvidia
I've received several messages imploring me to look at Nvidia’s chart. Don't panic, but investors need to be aware of a few key points.
You've reached your free article limit
You've read 0 of 1 free Pro articles.
One of my mentors had a way with words. The man would spout forth market wisdom on a regular basis, knowing just what to say at just the right time.
Here’s one of my favorites from him:
“It’s not time to panic, because it’s never time to panic.”
The guy was probably a Douglas Adams fan. The two key words in The Hitchhiker’s Guide to the Galaxy are, “Don’t Panic.”
That’s a true saying when it comes to the market. It’s even more appropriate when referring to this market’s fulcrum, Nvidia NVDA.
Nvidia is probably the most talked about stock in our universe. Over the past five years, this stock has gained over 1,200%. Nvidia has climbed 76% since May 6, when I wrote that the stock was “about to steal the spotlight” after several months of uninspired trading.
Not bad for a $4.3 trillion dollar stock.
We know why Nvidia is popular, but what makes it important? Two reasons:
- Nvidia is the poster child for AI, which is the key thesis for many investors these days.
- Due to its size, Nvidia is now the largest component of several key weighted indexes. The stock currently represents 13.5% of the Nasdaq 100 and 7.2% of the S&P 500.
Because of its size and influence, if something bad were to happen to Nvidia, the stock could simultaneously take down those two indexes, along with the AI sector.
I received several panicky messages on Tuesday imploring me to take a look at Nvidia’s chart. I wouldn’t describe what I found as alarming, but investors need to be aware of a few key points.
- On Tuesday, Nvidia closed below its 50-day moving average (blue) for the first time since May 1.
- Tuesday also represented the stock’s lowest closing price in over a month.
- A bearish pattern appears to be forming on Nvidia’s chart.
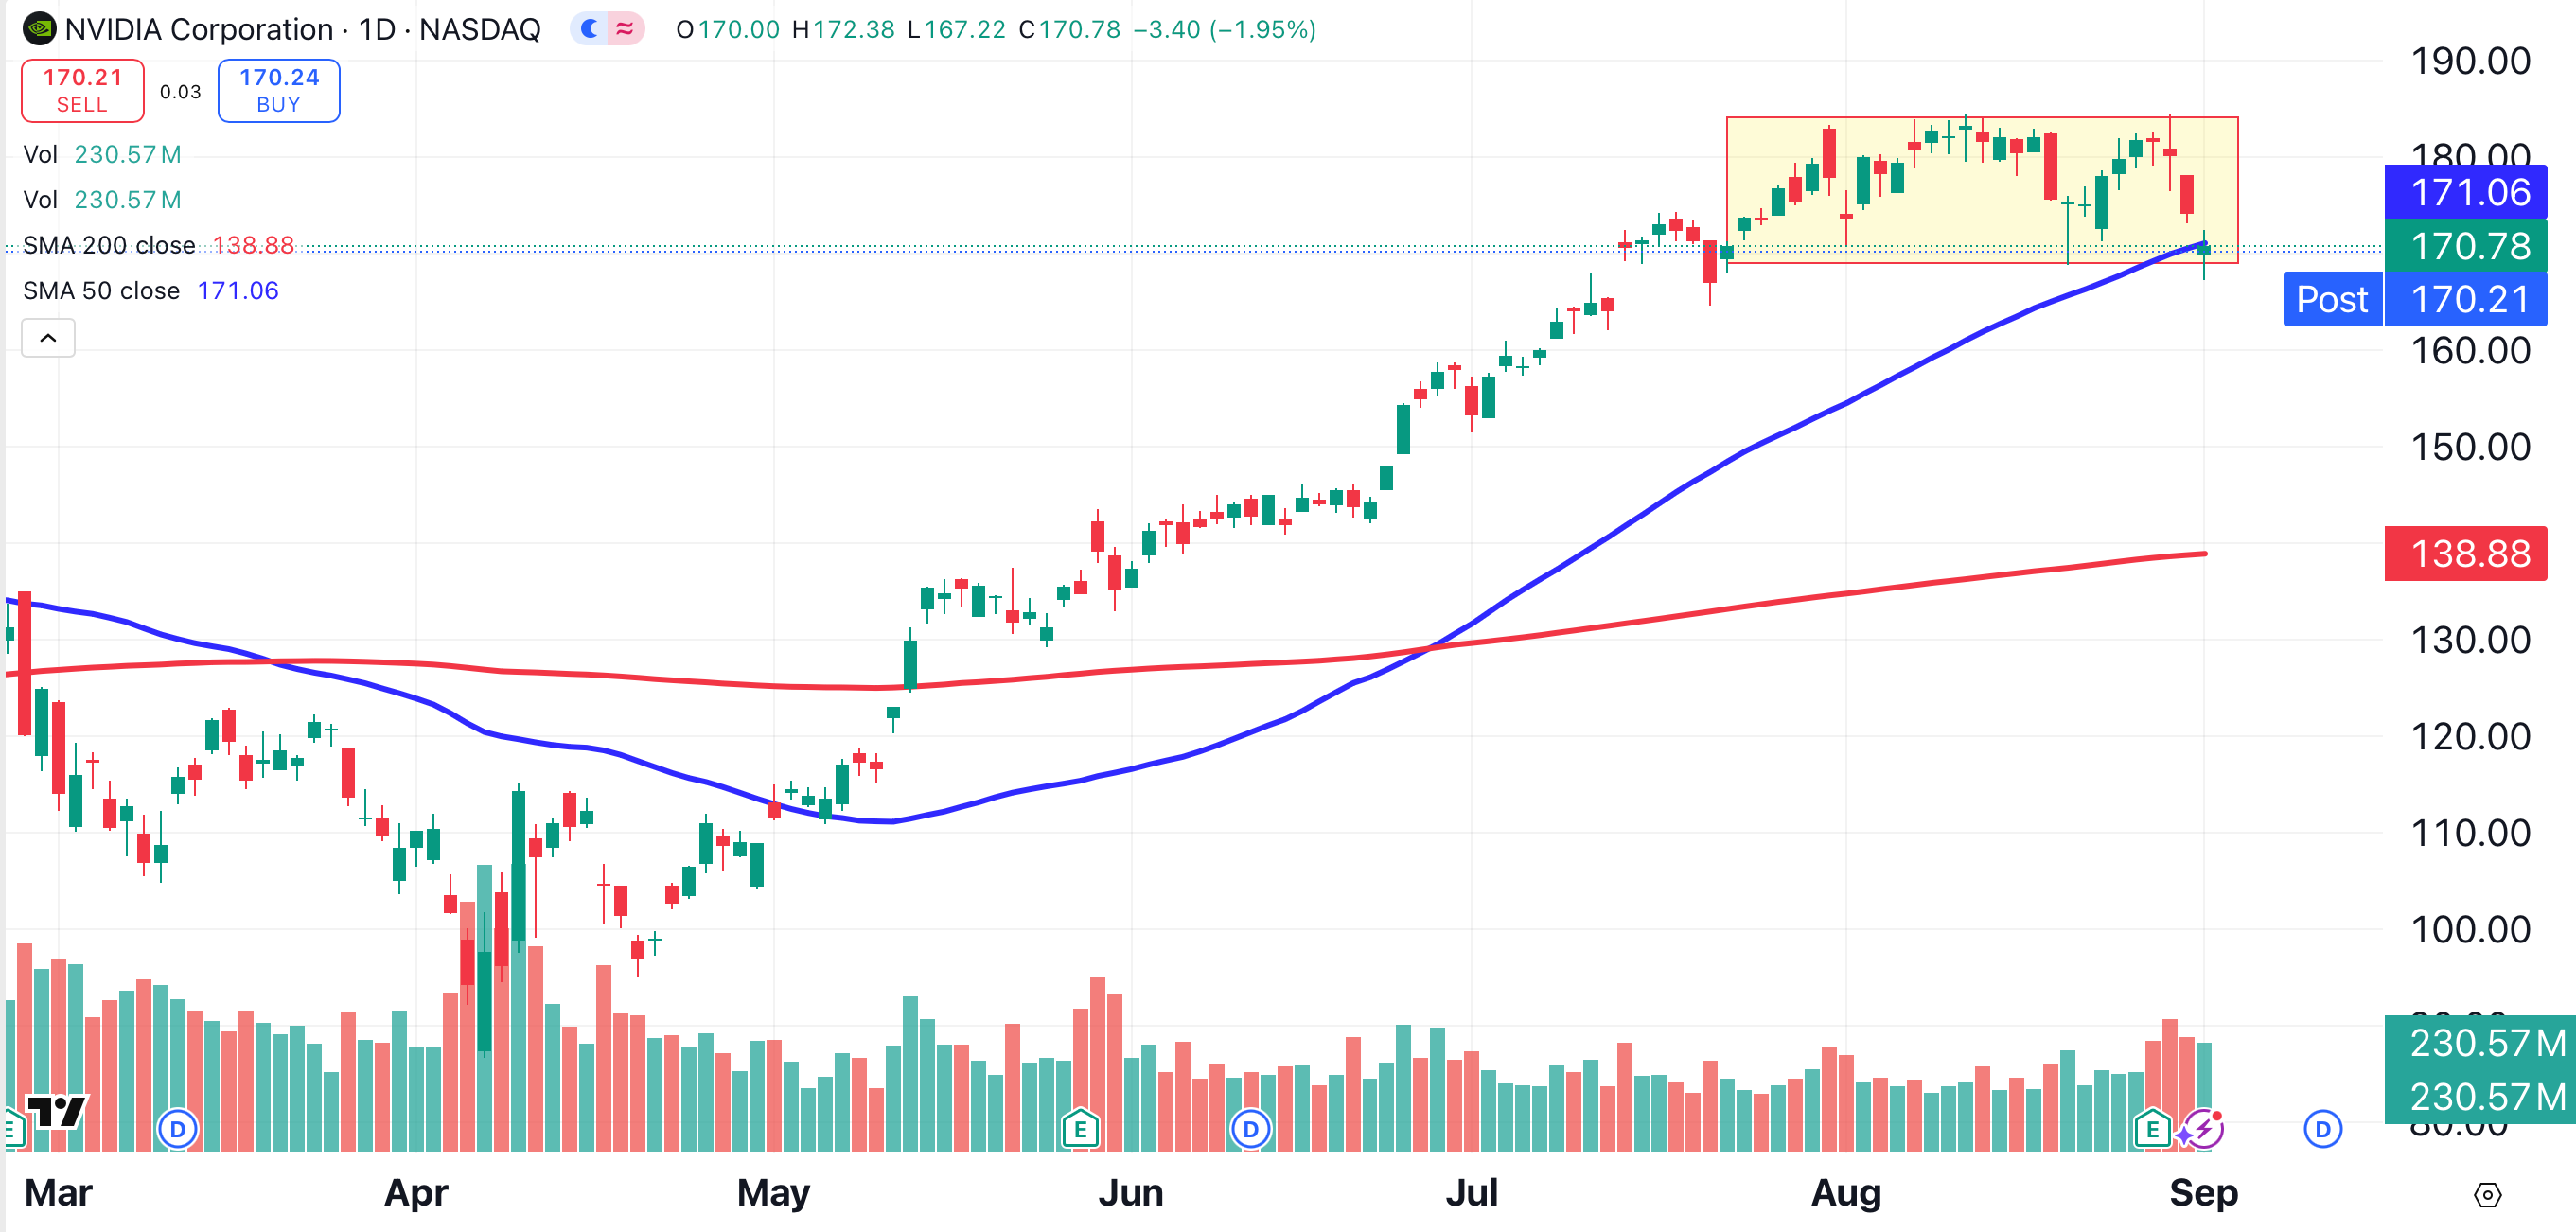
That pattern is best described as a triple top (shaded yellow). The formation suggests that Nvidia could see a decline to the $157 area.
The stock last traded at that level two months ago, on July 2. That’s a pullback I can live with. There's no reason to panic.
Markets ebb and flow. Every rally has pullbacks. We’re experiencing one now.
Are we about to go deeper? Maybe. Big rallies sometimes have deep pullbacks.
But there’s no cause for alarm. It’s not the end of the universe. Don’t panic.
At the time of publication, Ponsi was long NVDA.
