The First Pair of Negative Volume Days Since February
There has been a minor change in the indicators.
You've reached your free article limit
You've read 0 of 1 free Pro articles.
The Market
And you thought we couldn’t get a down day!
I can tell you this: the charts don’t feel great (they haven’t felt great for a week or more), but overall breadth was flat today. Maybe it was that energy was green because it was hard to find elsewhere, but breadth was not what led us down. Not on the NYSE.
Nasdaq, though, was another story. We had the first consecutive negative volume days (net volume, meaning more down than up) in nearly three months. Yes, it has been since May 5th and 6th that Nasdaq’s net volume was negative two straight days. If you are wondering, the last time we went three straight was not in March, nor in April, but in late February (we went four).
My takeaway from that is the same as it was yesterday: there is a minor change underfoot. As I noted last week, we had an awful lot of stocks that got sold on earnings and got sold on gaps down. And even those that haven’t gapped down like Netflix, continue to get sold.
Today was no different in that there were an awful lot of stocks that gapped down and/or got sold on either bad earnings or earnings misses.
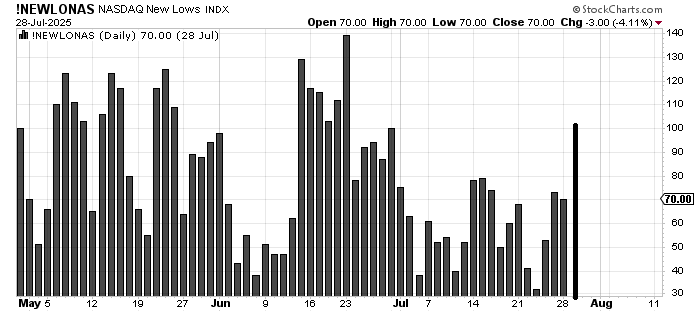
Statistically we saw Nasdaq’s new lows just to 100, the highest reading we’ve seen since the final days of June. So it’s not just that the volume on Nasdaq has been negative; it’s that new lows are also picking up.
If I had to pick one thing that is a positive, it’s that I think I heard almost every guest on television today cite ‘seasonality’ as a reason to be cautious. So if you want to be a contrarian, then you’d say too many are looking for a seasonal pullback. Maybe we get one more rally to shut them up?
All I know is that we’ve gone from almost every long working just fine to none of them working at all. That speaks to a market in flux, one where I think we should expect more volatility, not less.
New Ideas
Just a word on energy. I am surprised more folks aren’t fussing over it today. My guess is if energy is up again tomorrow, they will fuss. I bring this up because the DSI on oil is at 81, so I am not interested in chasing.
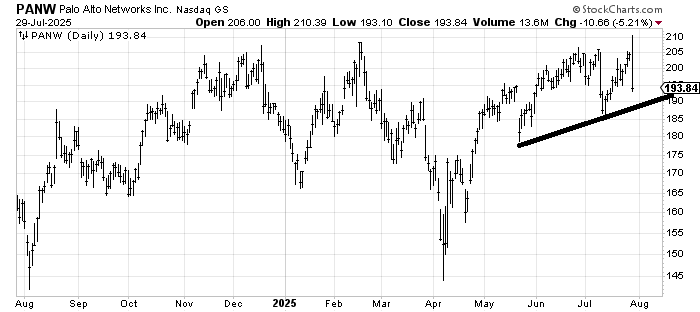
Now for a follow-up on Palo Alto Networks PANW, which I said last week I was warming up to. It looked like it was going to break out today and then wham! It sounds as if they want to buy Cyberark CYBR, and so the wrong stock took off and PANW fell.
Technically speaking, unless it breaks that 185-190 area, it hasn’t broken anything, but that is a giant outside day, and if they do opt to buy CYBR, we’d get caught in the middle of a deal, so I am going to stay away for now.
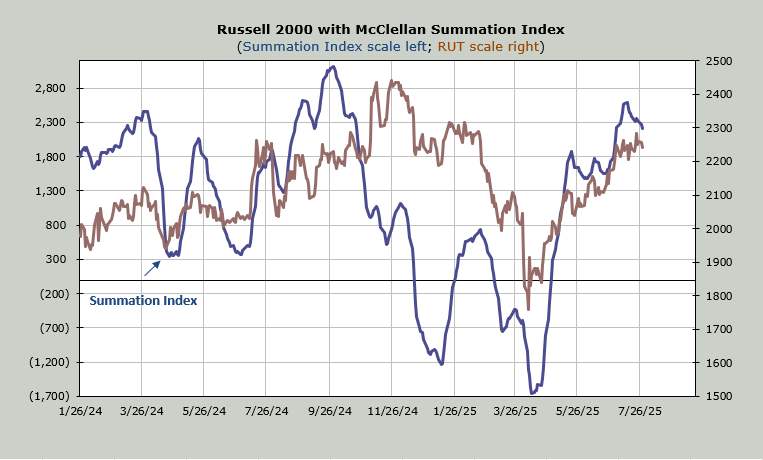
Today’s Indicator
The McClellan Summation Index is still heading down (despite the flat breadth today)
Q&A/Reader’s Feedback
Helene welcomes your questions about Top Stocks and her charting strategy and techniques. Please send an email directly to Helene with your questions. However, please remember that TheStreet.com Top Stocks is not intended to provide personalized investment advice. Email Helene here.
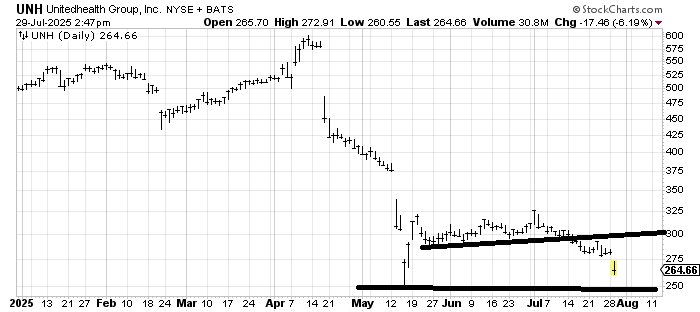
I think I am asked about United Health UNH at least once a week now. It is my view that spike lows tend to hold on the first trip down to test them; therefore, I think that 250 area does not break on this trip down. It is also my view that too many are looking to bottom fish in UNH, and there is no base to speak of so you are fishing and the water is not full of fish. Not yet. If the stock goes sideways for a few more months, it will likely become a good ‘tax loss’ play for year-end. Of course, by then, maybe no one will be asking anymore.
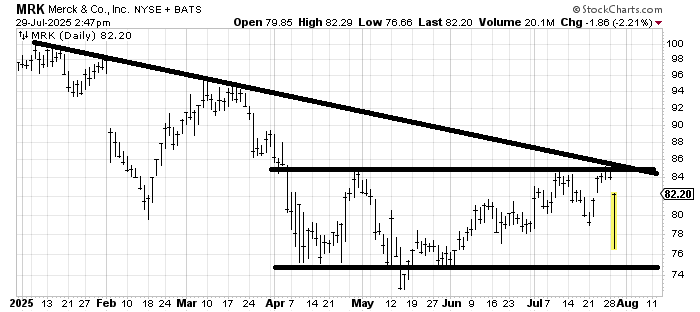
I have thought that Merck MRK has been trying to bottom for about a month now. It’s still working on it. I like that it wasn’t able to break down today. The chart is starting to look like a rectangle which is basically a period of time where you buy the low and sell the high. Eventually, one team stops playing, and you get a breakout. I would like to think the breakout is to the upside, but that would only come over that 85 area.
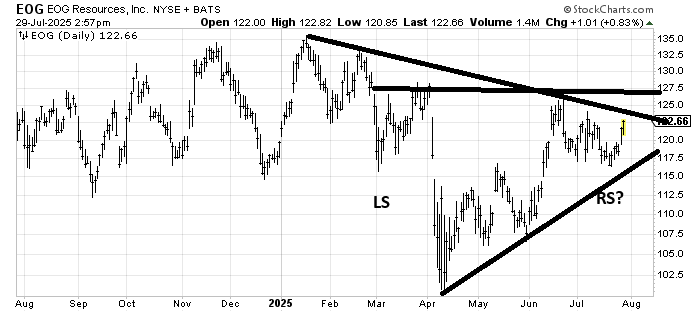
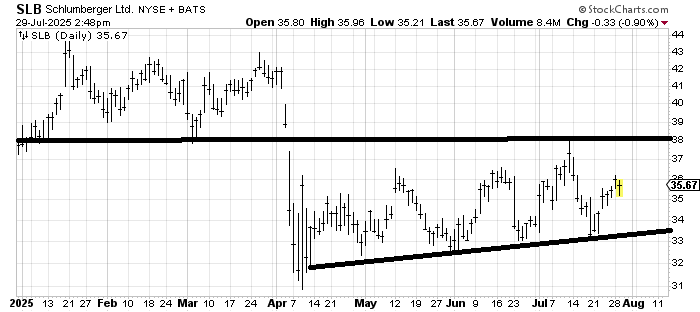
When I first recommended OIH, I also said I liked Schlumberger SLB. All SLB did was fill that gap at 38 and that was weeks ago. It’s still okay as long as it stays over 33. But the chart in the energy patch I am warming up to is EOG Resources EOG. Fair warning: earnings are out late next week for EOG. But it has that downtrend line around 124 and that flat line around 127. My guess is earnings aren’t great (it’s energy!), but this is a chart I have my eye on as a bottom fish