The 'Down and Outers' Finally Find Some Friends
A change occurred in the market Tuesday — and here's what it could mean for stocks overall. Let's look at some names that have new pals, as well as the dollar, Google, Netflix, UNH and more.
You've reached your free article limit
You've read 0 of 1 free Pro articles.
The Market
Something changed in the market Tuesday. I know, you’re thinking, what? It seemed like more of the same grind.
And I am not talking about breadth indicators or sentiment indicators. I am talking stocks, individual stocks. Long-time readers will know that I am, like a moth to a flame, drawn to down-and-out charts. Give me a chart that is up near its highs and I shy away. Give me a chart that is down and out and I will find a reason to think, hmm, can it be?
What changed Tuesday was that all these down-and-out names that I have been highlighting as positive charts for the last month or more found some friends. What’s more, several of the stocks that haven’t seen a down day in what feels like a lifetime, were down.
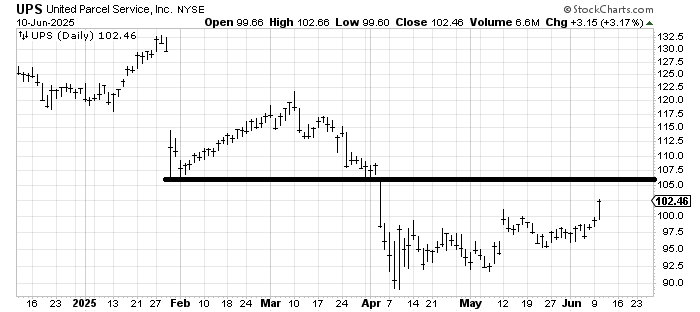
The down and outers I’m thinking of are names like United Parcel Service UPS. How long ago did I recommend that? Back in late April (and again a few weeks ago). I am still waiting for it to get to resistance and Tuesday went a long way. But look at that move: that’s folks searching for what hasn’t budged yet.
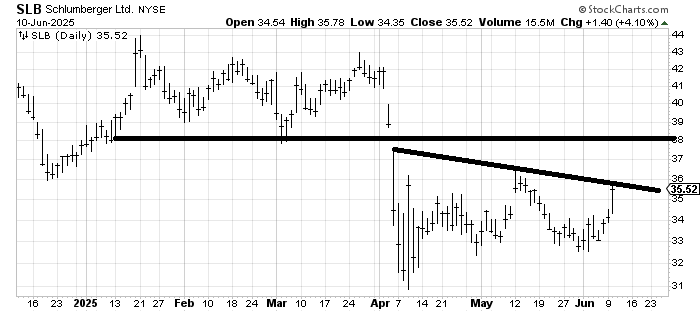
Schlumberger SLB is similar. We had that great pop from when I recommended it in late April and then it retreated. I reiterated my buy last weekend but again, that’s not the point: see Tuesday’s pop.
Even PepsiCo PEP, which I liked a few weeks ago, finally had a bit of a pop Tuesday. It’s still minor, but again, you can see where folks went Tuesday: the down and outers, looking for what hasn’t moved.

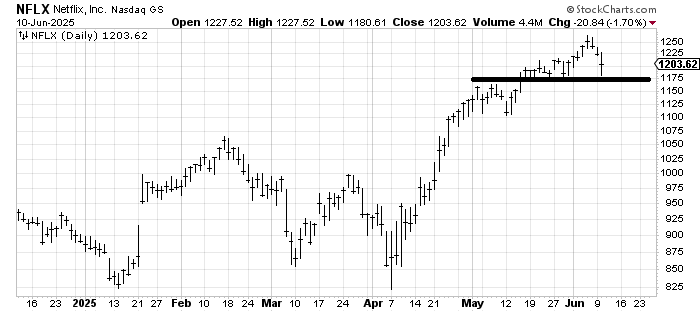
At the same time they were buying the down and outers they were selling what has been up, like Netflix NFLX. Oh it’s not awful, and it bounced off support at $1,175, but this is a rotation.
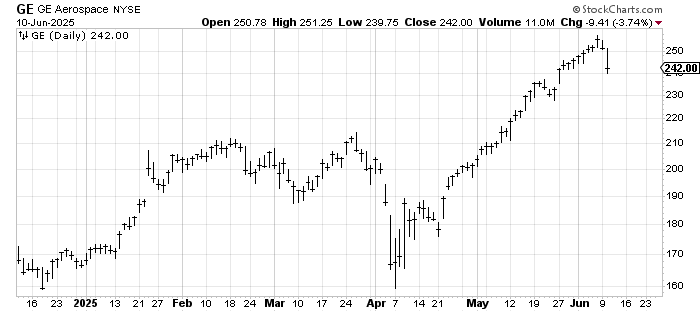
Finally, there is GE Aerospace GE, which had a minor dip in mid-May before resuming its rise. But look at Tuesday: it gave up two weeks of gains in one day.
In my experience when we see people start buying the down and outers — in other words, when my stocks start working so well — we’re getting much closer to a pullback. And we will be back to a short-term overbought condition late this week.
New Ideas
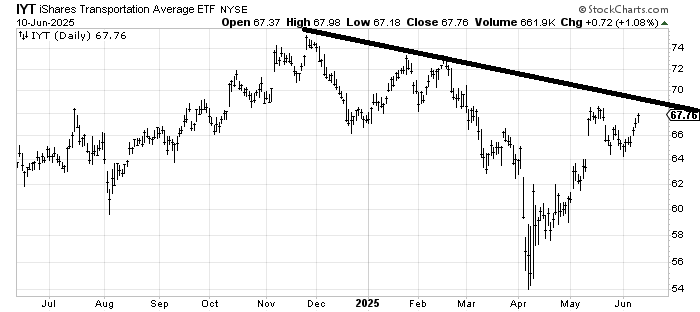
I was asked about iShares Transportation Average IYT, an ETF to be long the Transports. There are times where I prefer the index and times where I prefer a stock in the index. As you know my bet here has been UPS (and we had United Airlines UAL a few weeks ago as well). So when I see IYT and I see that downtrend line I think that line is likely to stop this rally for a while.
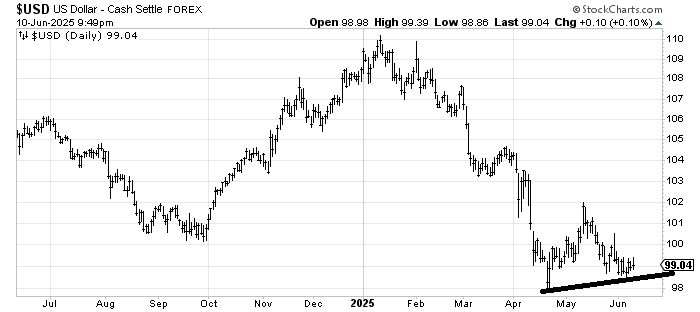
There has been a lot of chatter about the U.S. dollar of late and how weak it is. It has been weak. I have fretted over it at times. Yet I liked it in mid-April and I find myself drawn to it now. I am simply not convinced it is going to break but rather it ought to rally.
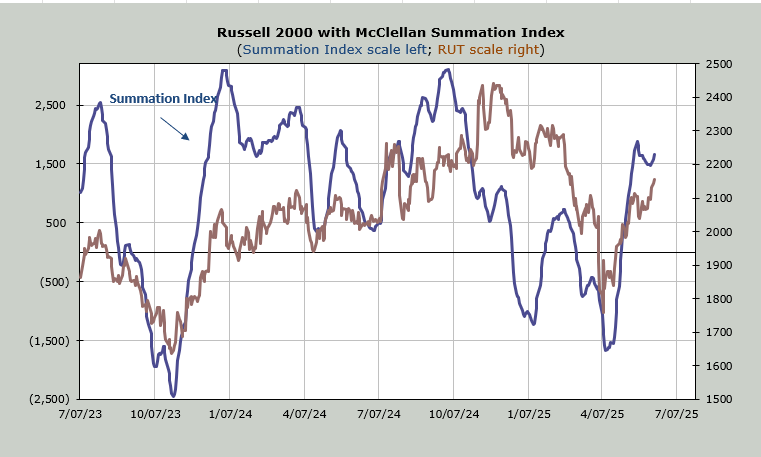
Today’s Indicator
The McClellan Summation Index is heading up.
Q&A/Reader’s Feedback
Helene welcomes your questions about Top Stocks and her charting strategy and techniques. Please send an email directly to Helene with your questions. However, please remember that TheStreet.com Top Stocks is not intended to provide personalized investment advice. Email Helene here.
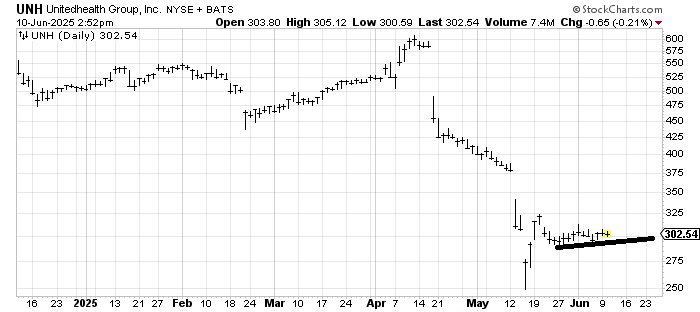
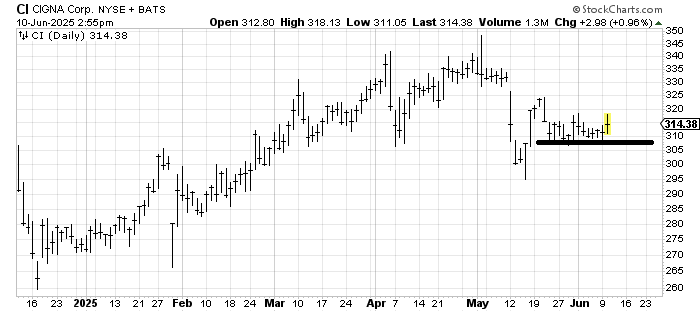
I was asked once again to look at UnitedHealth UNH. It actually looks like dead money to me but as long as it doesn’t break last week’s low it gets the benefit of the doubt. As I have said the last few times I have been asked about it, I’d rather be in Cigna CI.
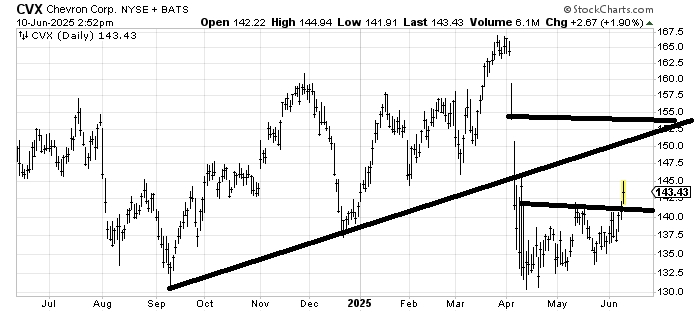
Since I have warmed up to VanEck Oil Services ETF OIH and Schlumberger SLB I was asked about Chevron CVX. It’s fine too. It’s got resistance at $145 and then again $150-152. I would not expect it to get much higher than the gap just over $152, though.
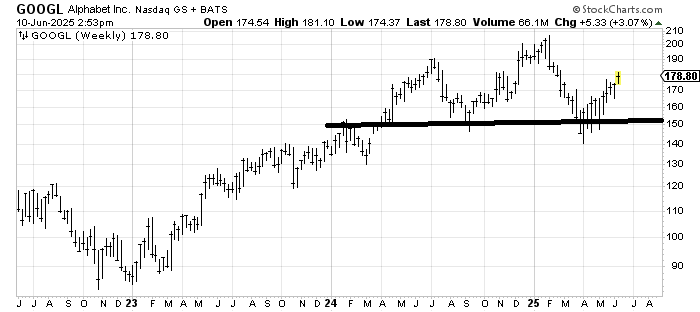
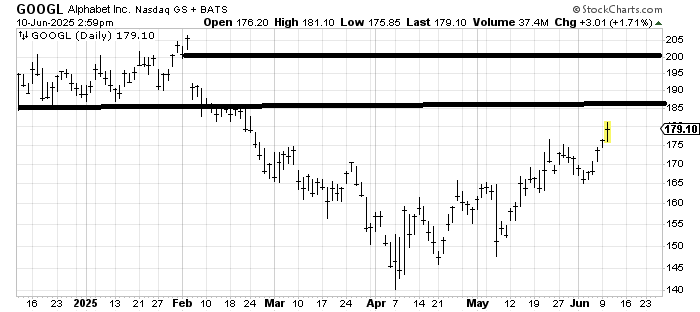
The question is if I see a head-and-shoulders top on the Alphabet GOOGL weekly chart. I do! But let me remind you that first of all I have been bullish on GOOGL since it was around $150 and then at $160 (perhaps I am biased). I have a target around $185 (lower line) with a possible chance at filling the gap (upper line). Should the market sentiment finally get too bullish when (if) we get there then I would be happy to entertain the head-and-shoulders pattern (the left shoulder is at $190).