Bulls Are Retreating, but We Need More Bears to Have a Meaningful Bottom
Let's look at sentiment to see where investors stand.
You've reached your free article limit
You've read 0 of 1 free Pro articles.
 Bull and Bear Wrestling in Suits
The Market
It feels like everyone has become bearish this week, doesn’t it?
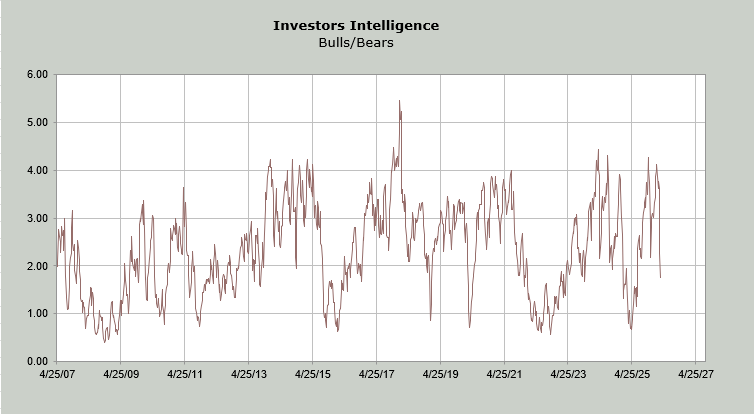
Well, let me tell you the Investors’ Intelligence bulls are down to 42.6%. As a reminder, they were 63% in early February. So yes, I would say the bulls have pulled in their horns. The bears are up to 24.1%, so I would not say folks are bearish, using this metric. Perhaps by next week, the bears will lift into the 30s.
Finally, the Bull/Bear Ratio is now 1.77. In February, it got to 4.2. Last week it was 2.25. A reading under 1.0 is bullish because it means we have more bears than bulls. I do want to point out that while we have had rallies from under 2.0 each time, they have ultimately had to go to under 1.0 to get to a good low.
The put/call ratio continues to rise. Today’s reading is finally showing some bearish conviction with a reading of 1.06. We still do not have a reading where the ISE is double digits, not triple digits. The current reading is 1.22.
The DSI for the S&P is at 33, and Nasdaq is at 39, so once again, they are not close to an extreme.
What I did not see today was panic. 79% of the volume was on the downside. Folks continue to hold the semis and the utes. And I suppose we could add energy in there.
What we do have is a market that is short-term oversold, but the bounce we got this week was rather pathetic. Consider that typically when we get oversold, we have much stronger bounces.
I think we can rally short-term, but I will continue to wait for the intermediate term indicators to line up.
New Ideas
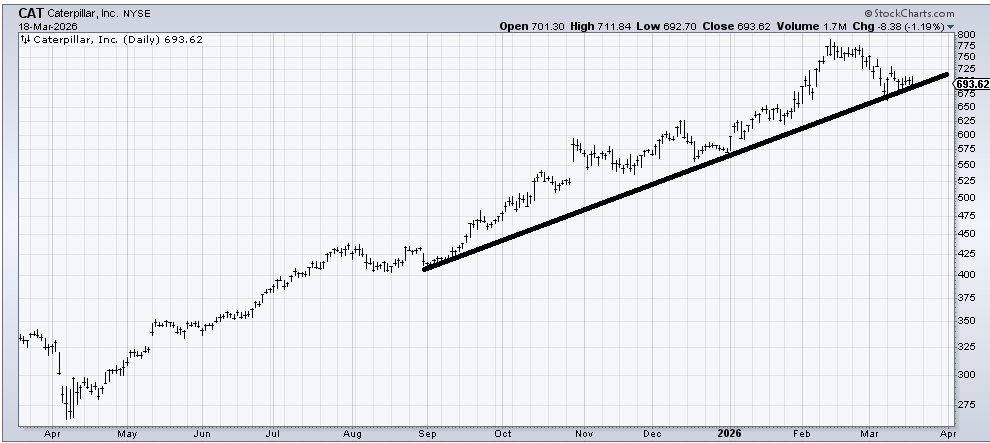
Caterpillar (CAT) has been a data center darling this year. If it breaks that uptrend line, that would be a problem.
Today’s Indicator
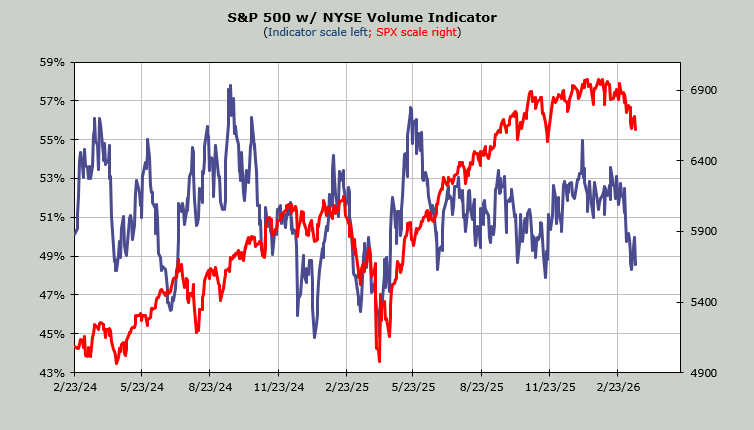
The Volume Indicator sits at 49%. In bull markets, it gets oversold near 47%, and in bear markets, it is the lower 40s.
Q&A/Reader’s Feedback
Helene welcomes your questions about Top Stocks and her charting strategy and techniques. Please send an email directly to Helene with your questions. However, please remember that TheStreet.com Top Stocks is not intended to provide personalized investment advice. Email Helene here.
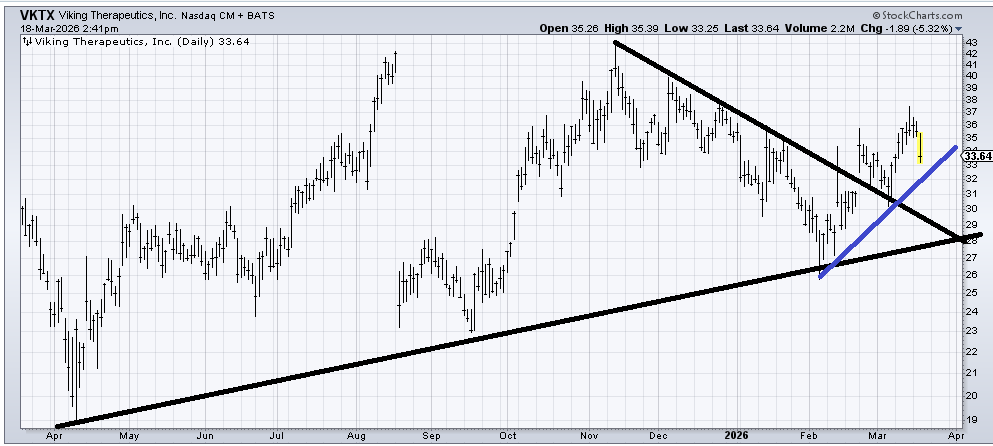
Viking Therapeutics (VKTX) has some light support at the blue lines (32-ish) and much better at the black line (29-ish). In a better market, I’d be a buyer at the blue line, but I look at this chart and see resistance overhead and would therefore exercise patience. For example, if it is around 29 when we get intermediate-term oversold, and the sentiment indicators are properly bearish, I’d be willing to step to the plate on it.
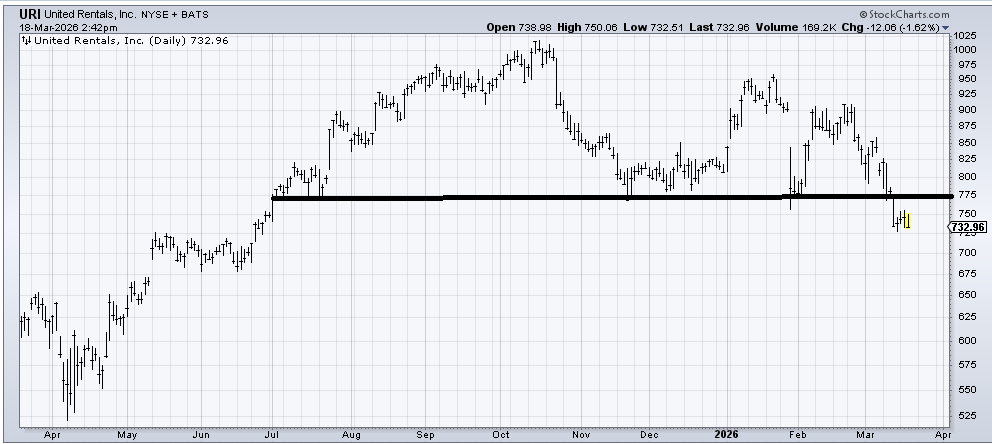
United Rentals (URI) broke the support line I highlighted last time we looked at it. I think it goes lower, but so far it has fallen and sat here, so if you want to wait and see if it can recapture 775 within the next week, then that’s fine because it is oversold. I don’t like the chart.
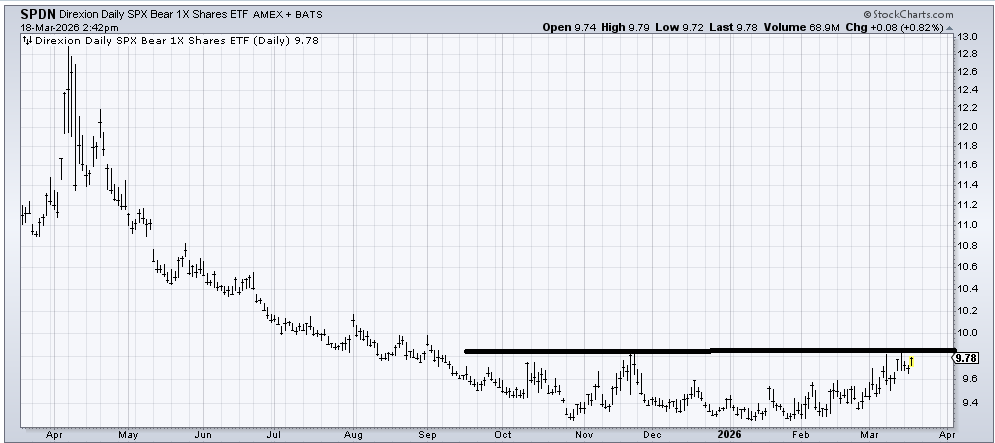
SPDN is simply the S&P chart turned upside down. I don’t like the inverse ETFs because I think they are the types of vehicles that are only for short-term trades, no matter how good they look. In any event, crossing that line is the same as breaking 6500 on the S&P, and we’ve discussed that in full on Sunday evening.
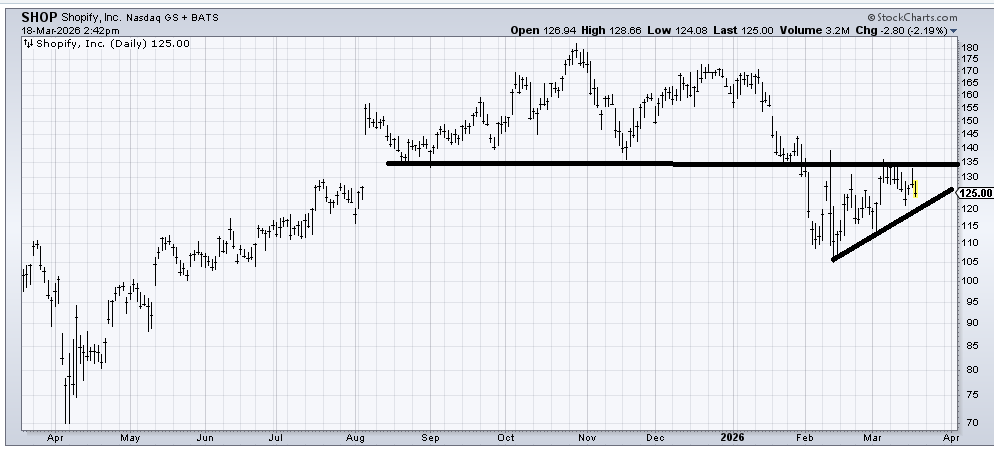
Shopify (SHOP) has enjoyed a nice rally to resistance. Now, if it breaks that uptrend line (120-ish), I would think it could come down and fill that gap near 95 over the intermediate term. So holding 120 is important.
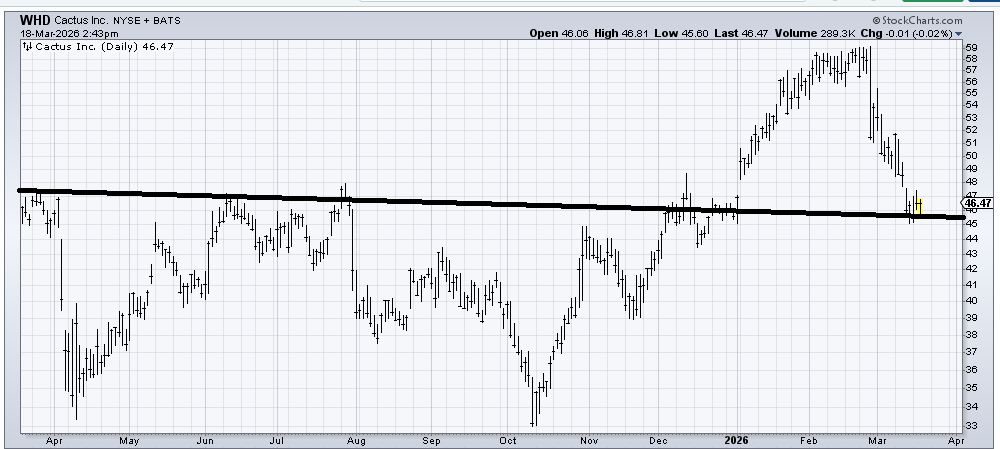
Cactus (WHD) is at support and likely oversold, having been down so much over the last three weeks. If we were intermediate-term oversold and had extreme bearishness, I’d like this here. So if it is still in the 45 area (or over it) when we get to that point, it would be worth a trade.
Related: Fed Chair Jerome Powell Reveals Intent to Stay While Detailing Rate Cut Decision
