The Bulls Are Back ...and They Love the VIX?
Let's look at the interesting tidbits from today's action, including breadth, AAII sentiment, and the Put/Call ratio for the VIX. As well as answering your questions.
You've reached your free article limit
You've read 0 of 1 free Pro articles.
The Market
There were a few interesting tidbits in today’s action.
First, breadth was positive most of the day while the S&P struggled. Then the S&P ran late in the day and breadth stayed where it was. All that tells us is someone(s) decided to pile into the index late in the day.
But it also tells us that for the second day breadth lagged. It hasn’t changed any of the indicators yet, but as long-time readers know, good breadth gets the indicators overbought and then bad breadth is what rolls them over. We’re still in the ‘not yet (intermediate-term) overbought’ stage.
Then there is sentiment. Let me begin with the massive move in the AAII bulls because they were up 18 points to 43%. Now 43% bulls isn’t high (we were at 50% in early December, but the fast move from bearishness to bullishness is like a whipsaw. We did not see that sort of move in the Investors Intelligence bulls (they gained two on the week but I do expect to see them higher next week).
I did go back and look at the prior times bulls jumped 18 points. Since 2006 there were seven times this occurred. Once, in early January 2009, it was quite bearish. In mid-July 2010 we hung around and rallied a bit more before we headed down again. The other five times (April 2005, January 2006, March 2009, November 2020, and November 2023) were overall bullish, although not all in a straight line. I suppose the takeaway from this is that if this is not January 2009 or July 2010 this is overall bullish when the bulls jump that much.
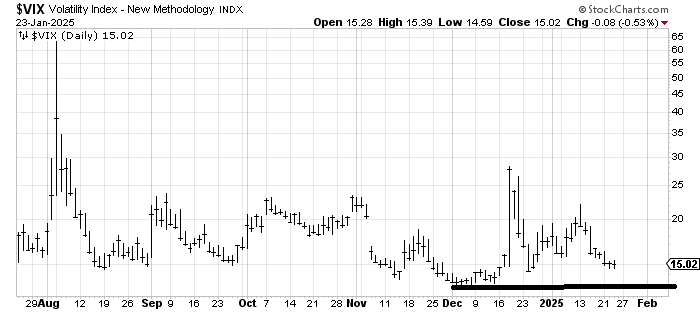
Then there was yesterday’s put/call ratio for the VIX. I don’t discuss this put/call ratio often but it is, on balance, played by the pros, thus I don’t consider it contrarian. It slipped under .20 on Wednesday.
We don’t see that often these days but since May it has occurred four times. In May it took a few days but within a week the S&P was down about 65 points. In late June it was a quick 20 point whack but not much more. In late August the very next day the S&P lost 120 points. And then when it occurred a week later the next day the S&P lost nearly one hundred points.
My own Overbought/Oversold Oscillator gets short term overbought early next week. With the run the market has had and the VIX put/call ratio dropping so low (pros are betting on a higher VIX) do not be surprised if we get a whack in the market. We have already tacked on 120 points this week even though many came into the week looking for a pullback.
I still think a pullback would lead to another rally.
New Ideas
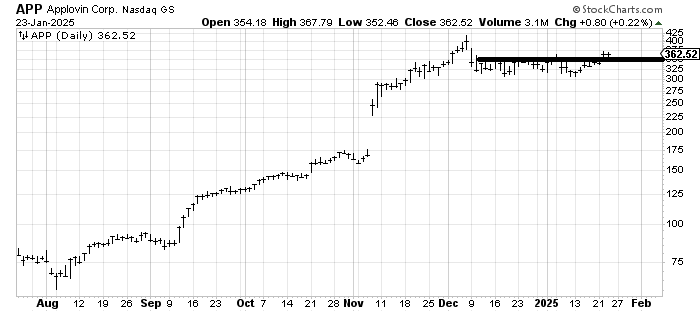
I want to do another follow-up. I was asked a while back about Applovin APP, and the stock has spent nearly two months doing nothing. If it can stay over 350, I think it makes a try at filling that gap near 400.
Today’s Indicator
The VIX put/call ratio is discussed in full above. Despite the rally in the S&P this week, the VIX hasn’t made a lower low (vs December). It is on my watch list for when we are overbought again.
Q&A/Reader’s Feedback
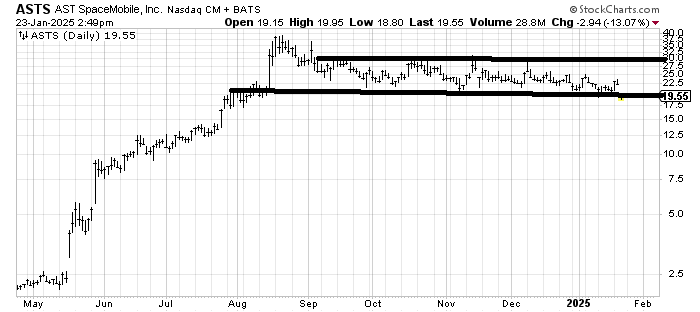
I do not like that AST SpaceMobile ASTS broke under 20 but I am also a fan of thick lines so I would give it a day or two to see if it can recapture 20. If it can’t then the next target is down in the 10-12 area so keep an eye on it.
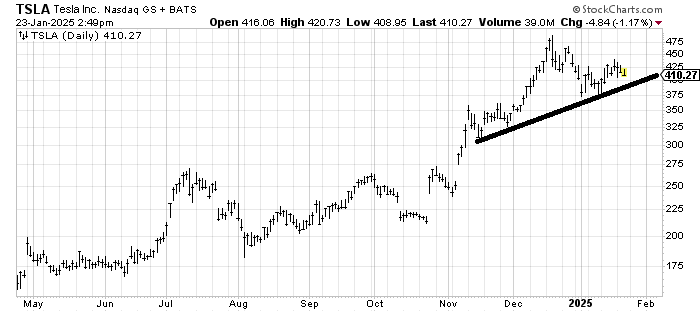
I don’t know what to do about Tesla TSLA because the lower high looks negative but it hasn’t broken the uptrend line/support. So for now unless it breaks 375 it’s possible this is one big consolidation/correction.
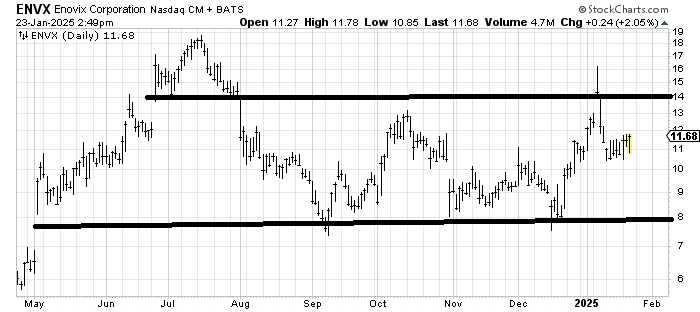
Enovix ENVX has been in this wide trading range since last summer so we play the range until it breaks. For now my inclination is to look for it to get back near the top of the range. At some point it ought to break the range and hold (unlike what it did in early January when it broken and gave it right back).
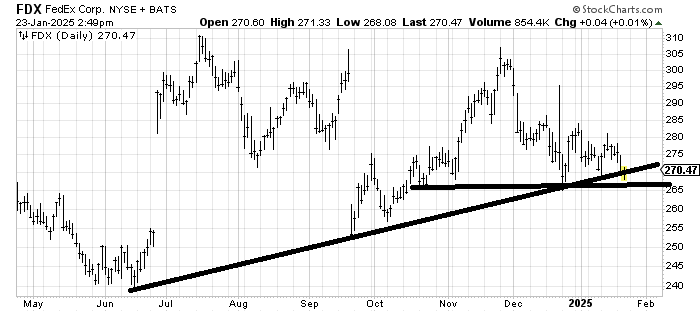
FedEx FDX is a difficult chart to read. Maybe that’s because they are about to split off part of their business. Since I am not supposed to care about the news (!!), I will just say that it ought to hold 265-ish. If it can’t I’d get concerned. The stock has not participated in the rally at all so you should really check when the spin off takes place because this looks so different than UPS.
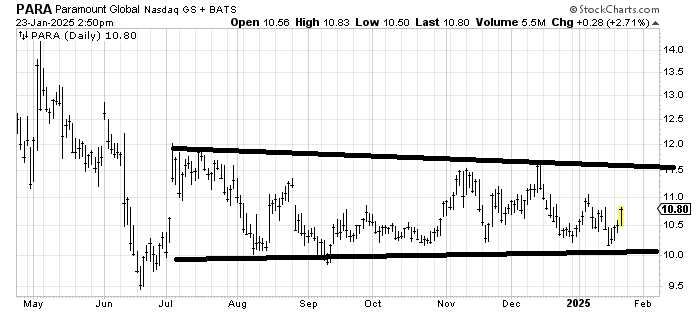
Paramount PARA is trying to build a base. That is one giant sideways it has mapped out since last summer. For the time being we buy the bottom of the range and sell the top of the range. But as it approaches the top or bottom we look for signs of a breakout. Since I tend to like down and out stocks with long drawn out sideways action, I am inclined to like this.