The Biggest Rallies Come in Bear Markets
And this was one of them. What a rally. Let's look at the indicators.
You've reached your free article limit
You've read 0 of 1 free Pro articles.
The Market
The long-awaited oversold rally arrived! Before we get to today’s statistics and if it changed anything, let me report that you are going to see a lot of statistics in the coming days that say things like:
This was the biggest up day since XYZ. This was the highest volume since XYZ. This was the largest reversal since XYZ.
In other words, there will be many superlatives for the trading that took place today. I would like to tell you to ignore them, but I can’t. Some of the largest up days do tend to come in bear markets. Some of the largest up days tend to come because shorts were forced to cover.
I will do my best to help us navigate it using the indicators, as we have done recently. But I can say this: I don’t expect anything to go smoothly. This remains a trading market.
Let’s begin with when we will be back to an overbought condition. My best guess is we start to wobble a bit by early next week. We ought to wobble and try to rally again. Then we’d probably be back to an overbought condition.
The Hi-Lo Indicator for Nasdaq is at .5 while the NYSE is at .6. Often when they get that low, there is a lot of testing and retesting the lows over the coming months. You cannot damage as many charts as we have without doing some work.
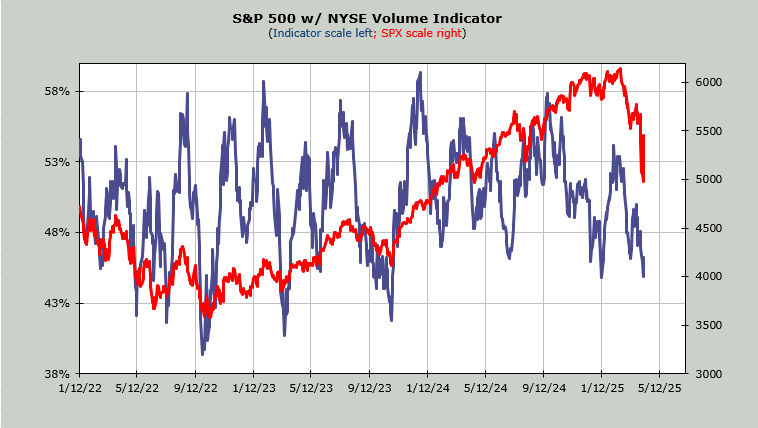
The Volume Indicator (shown below) is already back at .46. My best guess is if the rally can last another several days –even if it is off and on—this will be back over .50 a week from now.
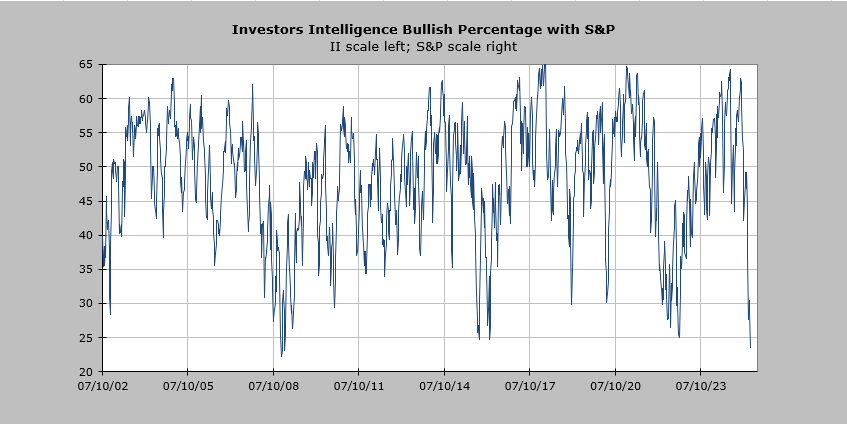
The Investors Intelligence Bulls were 23% when the survey was released this morning. That is the fewest bulls since October 2008. Note that October 2008 was the low for the majority of stocks but not for the indexes. The indexes rallied, came back down, rallied, etc. but did not make their low for five more months.
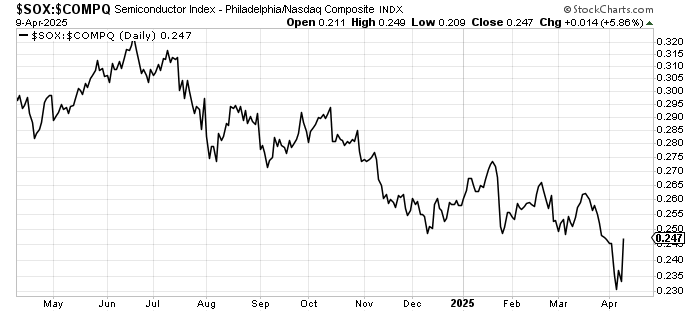
I think the ratio of the SOX to Nasdaq (shown here last night) helped us see the improvement, and you can see the big outperformance today. I will monitor this for signs that the rally is done.
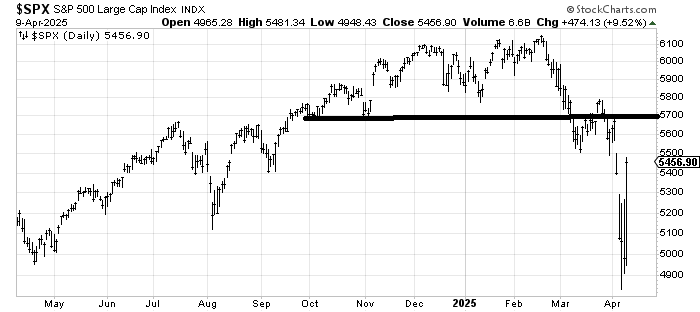
I know no one cares now that we have rallied, but the 50 and 200-day moving average lines for the S&P are now 35 points apart. They are likely to cross to the downside in the next week or two. Declining moving average lines tend to be resistance.
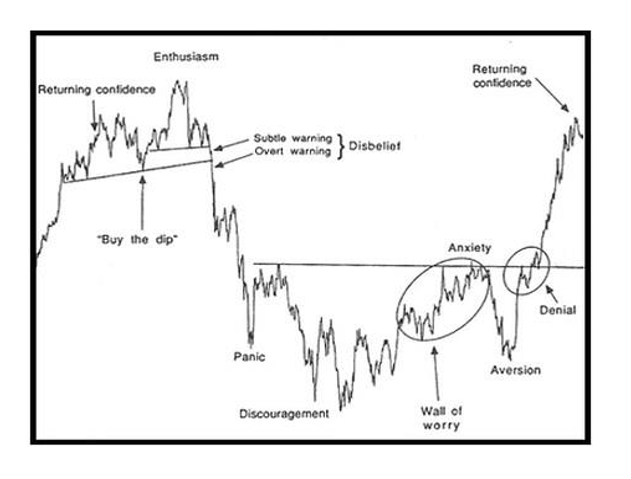
I promise I will stop using the Sentiment Cycle Chart soon, but we came into Monday with my belief that we were heading to Panic. So now I think we are in that rebound off of Panic. It need not be exact—doubtful it will be—but notice that after the initial surge, we did not head back down immediately but rather stayed elevated for a few weeks.
For now, I think we can still rally a bit more, even if it is in fits and starts.
New Ideas
The levels get fairly wide now. 5500 is where we gapped down under last Thursday, so that is probably short-term resistance on the S&P. But I have my eye on that 5600-5700 area. That would fill the gap and run smack into where the top broke down from.
Today’s Indicator
The Volume Indicator is discussed in full above.
Q&A/Reader’s Feedback
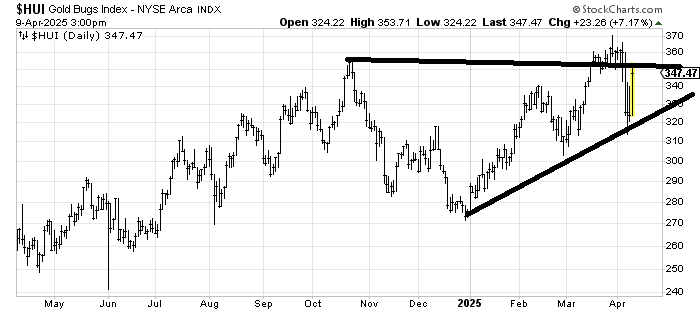
I don’t feel like I have a great read on HUI, the AMEX Gold Bugs Index, because it did not break down, so the trend is still up, but it has that resistance at 360 that will be tough to overcome. If it can clear that recent high then we’d be looking at an eventual target in the mid 400s. I’m just not sure it’s ready to fly.
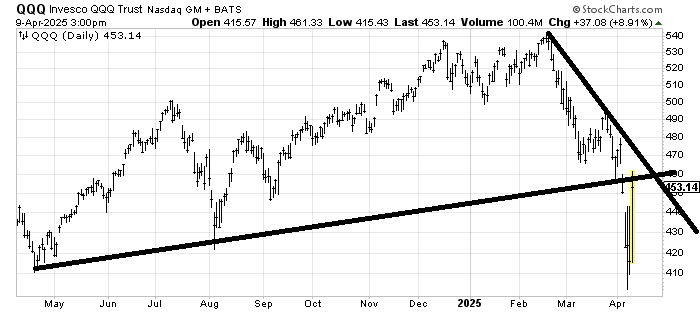
I drew in this lower line on the QQQs QQQ on Monday, and it’s still relevant as the first resistance area. I think the QQQs ought to fill that gap up near 470, though as the next target.
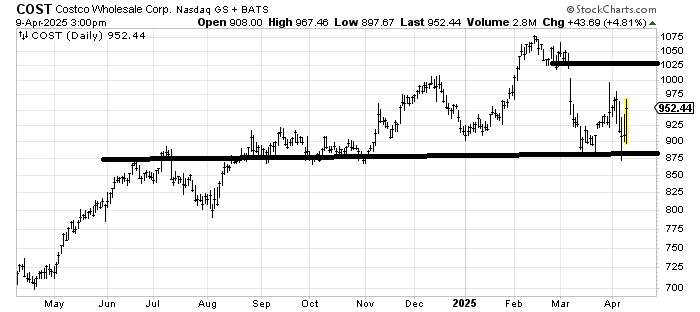
Costco COST is worth watching because it held up so well. If it fails at 1000, I would get very concerned that the chart is vulnerable in the next downturn.