That’s Not Panic, That’s Rampant Speculation
Wall Street has once gain turned into 'Penny Lane' and this speculation in penny stocks isn't normal or healthy. Let's break it all down and take a look at Pfizer, Johnson & Johnson and more.
You've reached your free article limit
You've read 0 of 1 free Pro articles.
The Market
Tuesday seemed to be part of what I have been talking about, the index movers took the indexes down but elsewhere the selling was minimal. Not much changed in the indicators so all I ask is you go back to the table I showed Monday and see that you can pencil in a red day for Tuesday, thus the scenario is shaping up.
But this time I want to revisit the speculation in the market. I have written about it before but it has been several weeks. My main contention has been that there was far too much speculation in crypto but that has morphed in the last month to penny stocks.
The Nasdaq saw its highest volume ever Tuesday as it clocked in at 13.5 billion shares. Normally I would say that’s terrific, it means folks are panicking. But you see, 65% of the volume was on the upside. That’s not panic, that’s speculation in penny stocks.
For the last 10 trading days net volume on the Nasdaq has been positive every single day. And we all know the Nasdaq has had plenty of red days in there, and not small red days. Eleven trading days ago the Nasdaq closed just below 19,600 and now it stands just under 19,500, so it’s essentially flat. Yet net volume has been up every single day. This is not about the Mag 7 or the index movers.
There are so many penny stocks that are trading millions of shares each day. Stocks you probably don’t even know or have ever heard of. There is one stock, ticker CERO that closed at a nickel — yes five cents — and traded almost 900 million shares Tuesday. Oh and it was up 23% today because it was up a penny.
There are plenty more where that came from. To put this in perspective, Nvidia NVDA had a big day Tuesday volume wise, and it traded the highest volume since November, and it only traded just under 350 million shares.
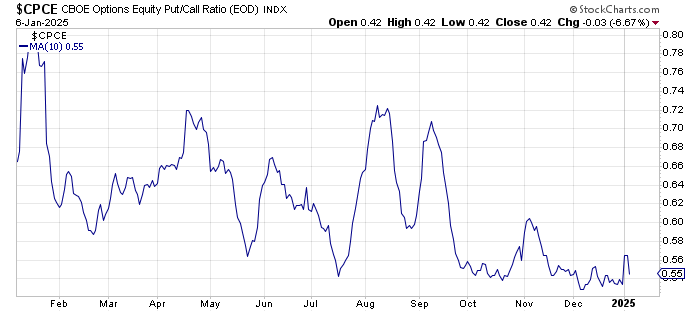
We see it in the options ratios as well. You would think folks might have repeated the actions of last Thursday when we saw all those puts bought, but that would be incorrect. They were loading up on calls today, as if they were after the holiday sales. The put/call raito was 0.78, the same reading it was the day after Christmas.
This rampant speculation in options can be seen in the 10-day moving average of the equity put/call ratio. The moving average hasn’t pushed over 0.60 since the election, and only then it did so barely. I could take this chart all the way back decades and we wouldn’t see this.
I don’t know how the next few weeks plays out. I do know how I would like it to play out (down into that oversold condition I discussed in the last few days) and I do know that speculation such as this is not normal or healthy for this market, or any market.
I will end by noting that I would have liked to see more concern and bearishness about bonds Tuesday than I sensed we got. But the DSI is now back to 10 so we are closer to a bounce in bonds than not.
New Ideas
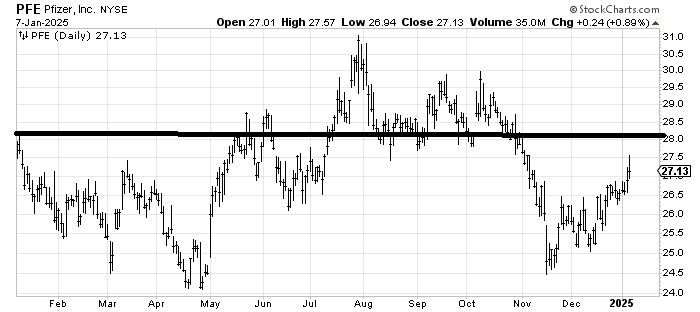
Pfizer PFE, which I warmed up to several weeks ago, has been creeping higher. I want to point out that the resistance at $28 looks formidable and I would think the stock is unlikely to blast through the first time up.
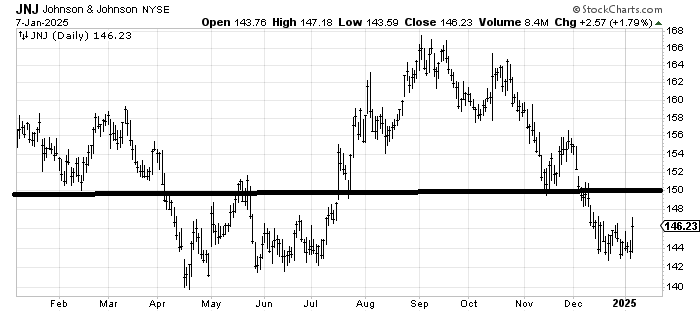
Johnson & Johnson JNJ, another drug stock I have liked, runs into resistance in the $150-ish area.
Today’s Indicator
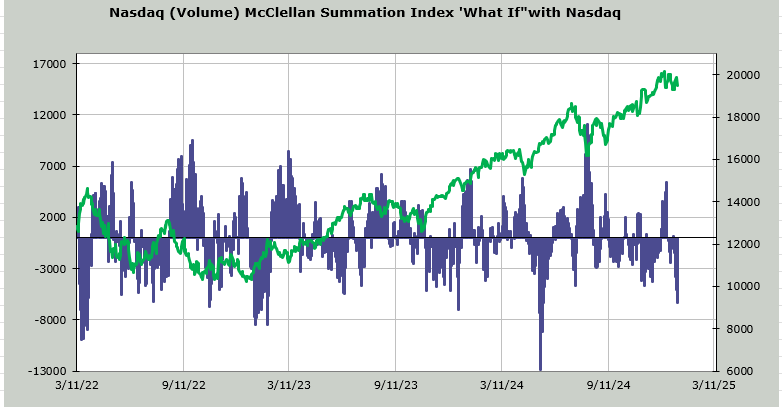
The McClellan Summation Index is flat after turning back up. But today let’s look at what it will take to turn the Nasdaq McClellan Summation Index down from its present up because here I use net volume (instead of the A/D) and with net volume positive for the last 10 days it would now take a net differential of -6.4 billion shares (up minus down) to halt the rise. That is closing in on very overbought (for those penny stocks!)
Q&A/Reader’s Feedback
Helene welcomes your questions about Top Stocks and her charting strategy and techniques. Please send an email directly to Helene with your questions. However, please remember that TheStreet.com Top Stocks is not intended to provide personalized investment advice. Email Helene here.
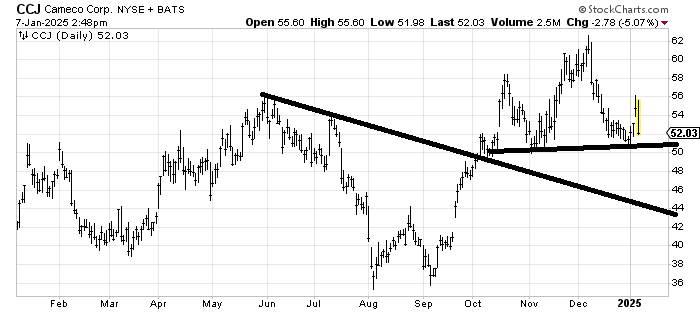
Cameco CCJ looks like a head-and-shoulders top. If it breaks $50 that pattern will complete it. If it holds it though, or dips under, shakes folks out and then rallies it will catch folks offsides. My inclination is that if it is still hovering around $50 when we get back to oversold the risk/reward would be good to take a stab.
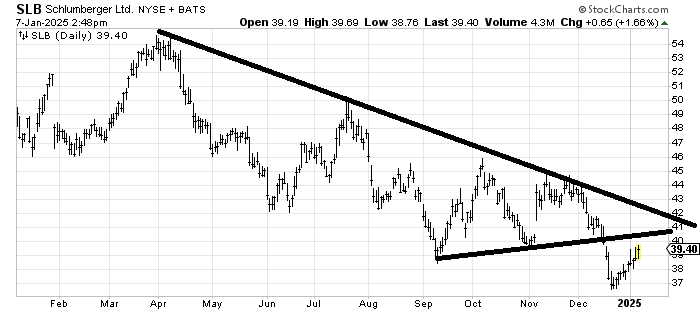
I turned more positive on energy as the calendar turned to 2025. Schlumberger SLB is no exception except that in the short term I think resistance is pretty strong in the $41-42 area. Making a higher high (over $44) is going to take al lot of work. I’d lean toward taking some profits if it got into the low $40s area.
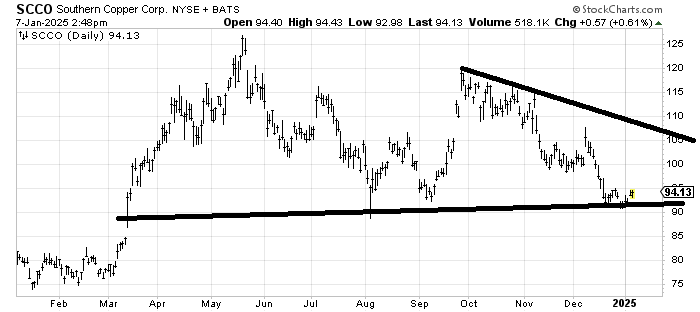
Southern Copper SCCO, like XME is trying to make a tiny little bottom so as long as it can stay over $90-ish I would look for it to rally when we get oversold again.