Tech Stocks Are Near All-Time Highs. Most Stocks, However, Are Not.
Group rotation hasn't propelled the rank and file higher, either.
You've reached your free article limit
You've read 0 of 1 free Pro articles.
The Market
This decline that the majority of stocks have been in began last summer. Yes, last summer. In my opinion, every little group rotation since then has been just that: little.
Oh, sure, we had the big explosion in gold and mining and quantum and rockets, but that ended when the fever broke a few weeks ago. Was today enough to end the AI move?
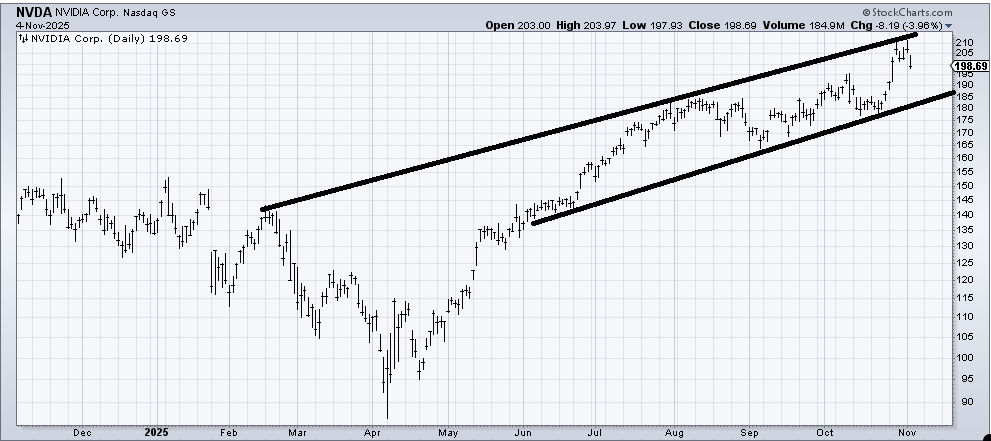
I honestly have no idea, but as I noted last week, I had an upside measured target for (NVDA) at 204 and one at 210, and thus far, that has been where it has stalled on two attempts. This is not the best channel I have ever drawn, but I think it’s been pretty decent at catching the highs, and so we’ll see if it can be helpful catching the lows. I wouldn’t look at the level the line is at now (180-ish), but rather where the line comes in a few weeks from now (190-ish later in the month). If it gets down there, we’ll pay attention.
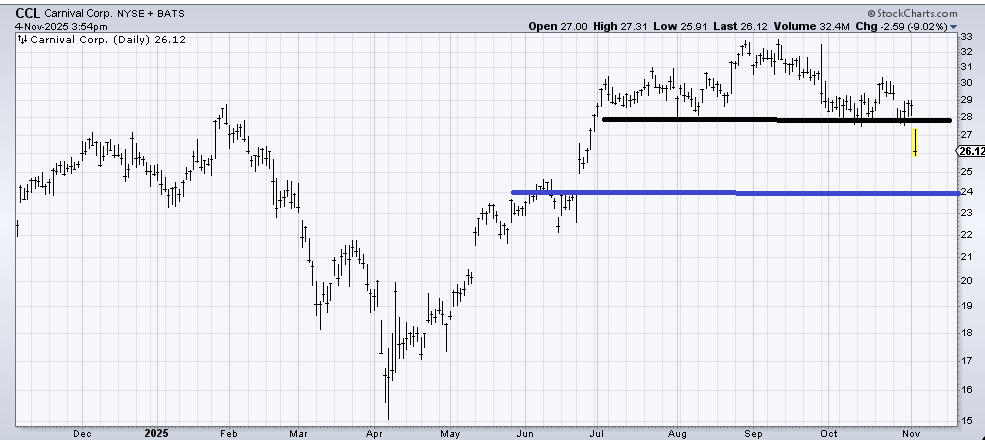
I am more interested in charts like Carnival Cruise (CCL) that completed an almost textbook head and shoulders top and then broke on a gap. In fact, we have so much of that: breaking on a gap. The top is not that massive, but it does eventually measure into that 24 area, which would fill that gap from June.
I am interested in it because, as I highlighted a few months ago, the restaurants look awful and have come down an awful lot. Just when you think they should hold at a prior low, they keep on going. We’ve seen similar action in staples and some drugs.
So the question is if the majority of stocks have been in either sideways or downtrends since the summer, aren’t they oversold by now? Take a look at the Overbought/Oversold Oscillator for Nasdaq. First of all, the fact that Nasdaq is ticking near its highs and the Oscillator is all the way down here shows you how weak the majority of stocks are.
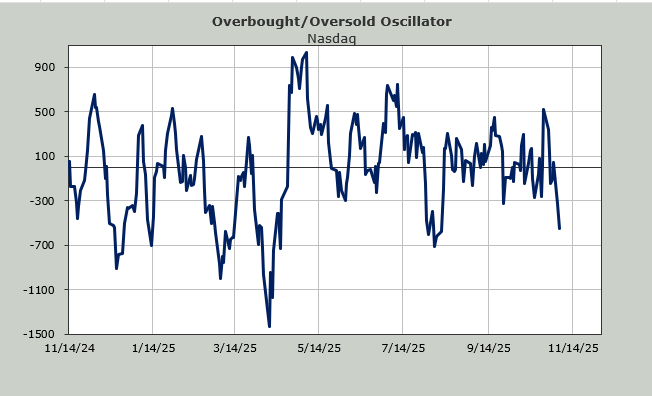
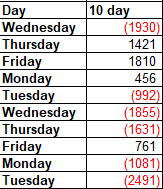
Now let’s look at the math behind it. It is the ten-day moving average of the net of the advance/decline line. So the level doesn’t matter (to me) so much as the math behind it. When we are set to drop a long string of negative numbers, I consider it oversold. You can see that ten days ago the net was -1930. That means we should probably rally tomorrow, just to lift the Oscillator a bit (the math!).
But then the next few days after that are still decent positive numbers. Earlier in the week, I said if we can get some negative breadth readings this week, we would set up again for an oversold reading. So if we can replace the Thursday, Friday, and Monday readings with red numbers, we’d be oversold by Tuesday with that long string of red numbers to drop.
I figure if we head south later this week, maybe we’ll see some of that sentiment change. Maybe we’ll see the VIX get jumpy. That would be a good setup.
New Ideas
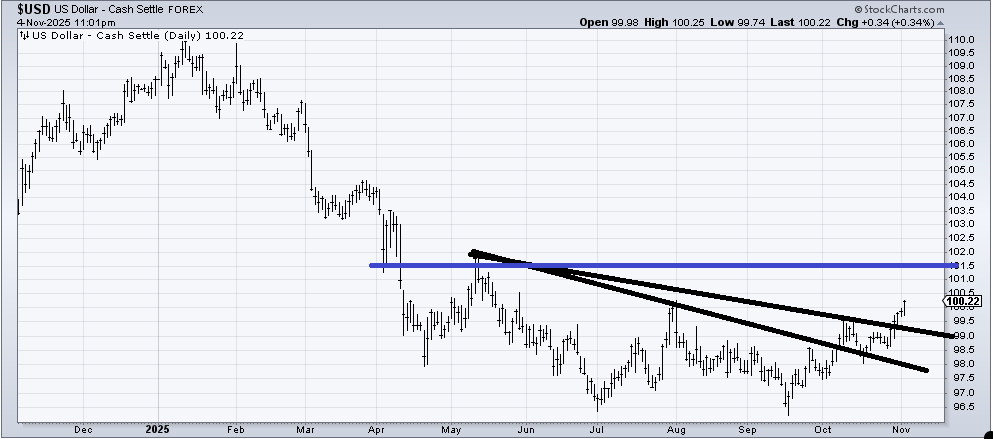
I have been bullish on the US Dollar since early July. It has taken its time to meander higher, and meander is the keyword. I did notice that there seemed to be quite a bit of chatter about the DXY today. It’s not excessive, but if it rallies much more, I can imagine the chatter. So I am here to report that while my initial target is around that blue line, the DSI is now 81, so I sure hope it has a little pullback to cool it off.
Today’s Indicator
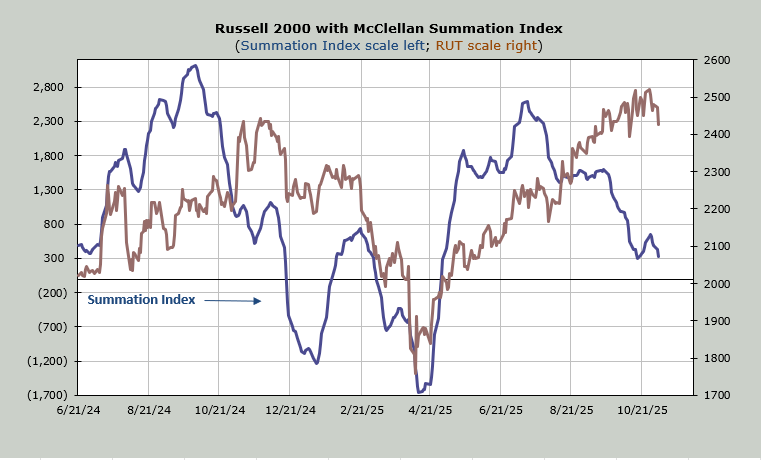
The McClellan Summation Index is heading down. It needs a net differential of +1900 advancers minus decliners on the NYSE to halt the decline. +3000 is oversold. +4000 is very oversold.
Q&A/Reader’s Feedback
Helene welcomes your questions about Top Stocks and her charting strategy and techniques. Please send an email directly to Helene with your questions. However, please remember that TheStreet.com Top Stocks is not intended to provide personalized investment advice. Email Helene here.
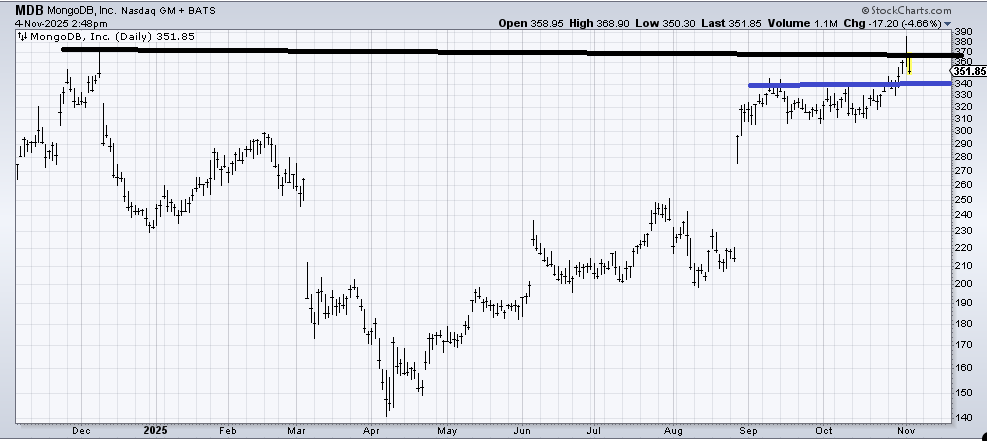
MongoDB (MDB) hit its short-term measured target when it got over 370 last week (based on the pattern from the blue line). Now, I would think that a new pattern must emerge. On a short-term basis, holding over 340 would be a positive, but that might be asking a lot. If it can hold 340 for a few weeks, maybe it shapes up again.
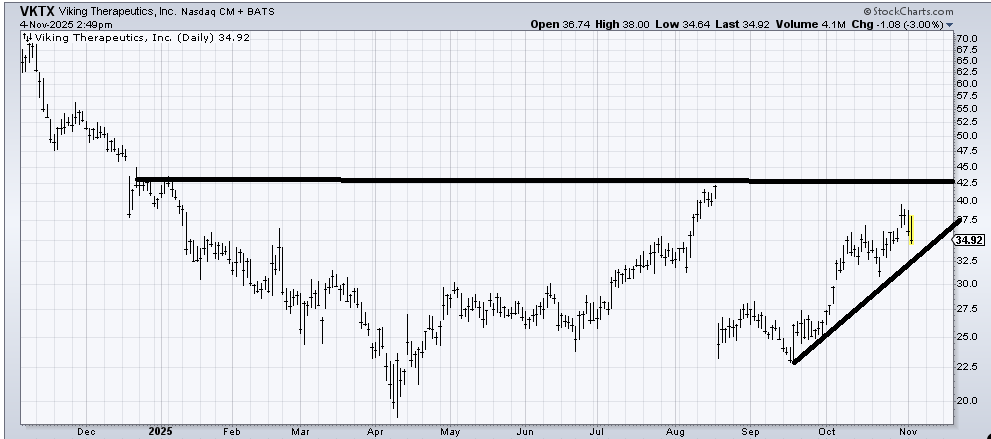
Viking Therapeutics (VKTX) is generally my kind of long-term chart because it seems to be building a base. But I do not like that it could not fill that gap at 42.50 on this recent run-up, so if the stock breaks under that spike low from two weeks ago (31-ish), I would get concerned; otherwise, it probably just needs more time to slosh back and forth to build a base.
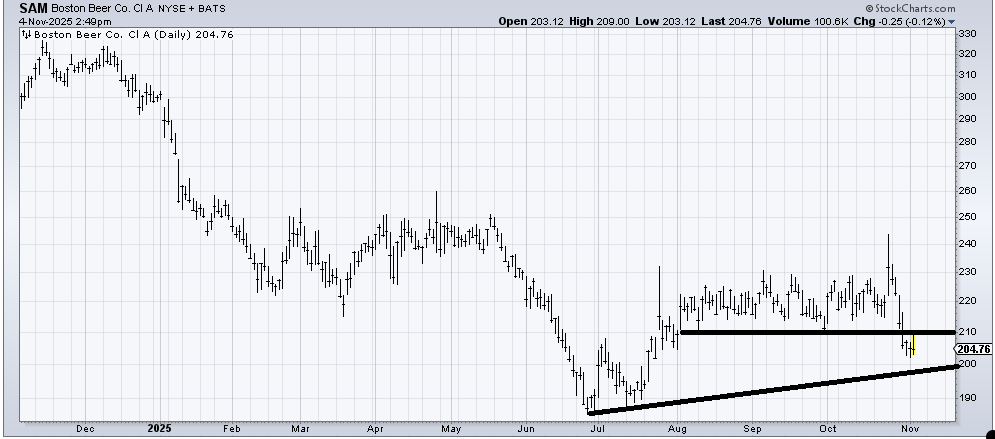
We looked at a chart similar to Boston Beer (SAM) last week that had been going sideways and then sliced through support like a hot knife through butter. It leaves that prior support as resistance now, but if SAM can crawl back over 210 in a hurry (one week), I would think this push under support was a shakeout. If it can’t get over 210, then it’s back to the drawing board for SAM.
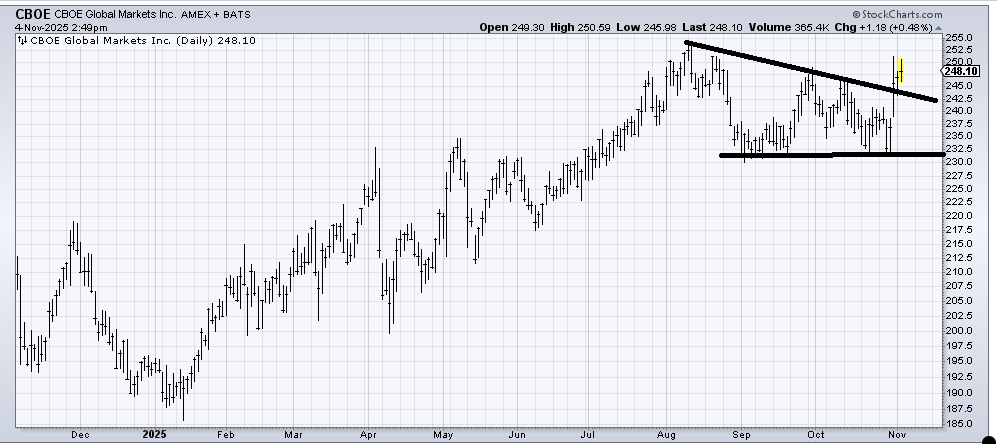
I don’t love stocks up near their highs, but CBOE (CBOE) did cross that downtrend line and is holding it. It’s got resistance, but as long as it stays over 240-242, it ought to be okay. It doesn’t have a great big, measured target, just something in the low 260s. Back under 240 and I’d get a little more concerned.
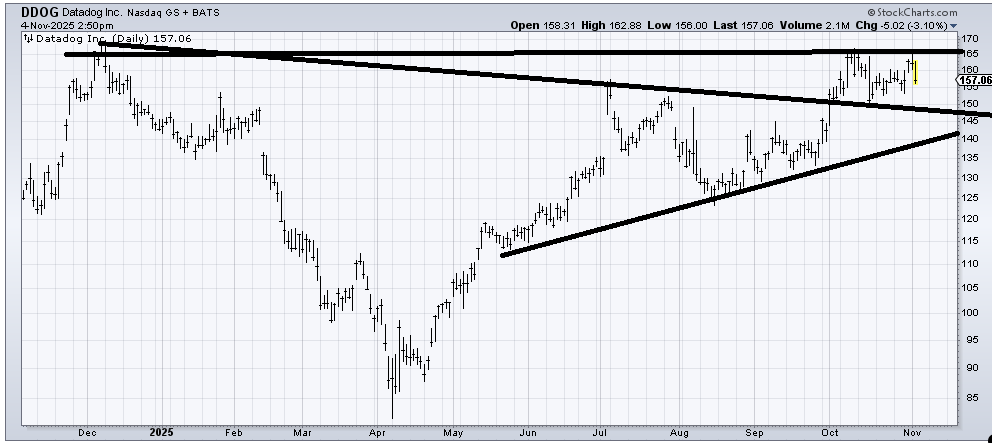
Datadog (DDOG) got to resistance twice and couldn’t get through. Now I would fret if it trades back under 150. And under 140, I’d turn quite cautious. So maybe it trades back and forth for a bit, but keep a tight leash on it in case it does fall under 150-ish.