Target Price Cuts Hit American Airlines but There Could Be a Trade
The airline is getting blasted by Wall Street just ahead of earnings but if it can hold this level, it might offer a profitable trade.
You've reached your free article limit
You've read 0 of 1 free Pro articles.
The news crossed my tape at precisely 04:27 ET this morning. I posted it to Twitter (or X) a few minutes later. Catherine O'Brien of Goldman Sachs, a one-star (out of five) rated analyst at TipRanks, had downgraded American Airlines AAL from "Neutral" to "Sell" while taking her target price down to $8 from $16.
O'Brien cited the firm's higher balance sheet leverage and operating leverage as risks that could drive significantly larger cuts made to estimates relative to industry peers as uncertainties cloud the nation and planet's economic and geo-political futures. O'Brien sees reduced free cash flow as demand for AAL's services ebbs.
Perhaps more impressively, Barclays' Brandon Oglenski ("more impressively" because Oglenski is rated at four stars), reiterated his "Hold" rating on Tuesday morning, while cutting his target price from $16 to $11. If you want to go all the way back to Monday (yesterday), Christopher Stathoulopoulos of Susquehanna, Thomas Wadewitz of UBS and David Vernon of Bernstein (all rated at either three or four stars) cut their respective target prices from $18, $13 and $17 to $10, $9 and $12, in that order. On Sunday (yes, we work on Sundays on Wall Street), the only five-star rated analyst in the bunch, Sheila Kahyaoglu of Jefferies, downgraded the stock from a "Buy" to a "Hold" without setting a target price.
American Airlines Stock Fundamentals
American Airlines has posted positive free cash flow for five consecutive years. For 2024, that number was an impressive $1.3 billion. But... for the fourth quarter, free cash flow printed at -$342 million. For the third quarter, FCF landed at -$191 million, so there is a losing streak going here, at least sequentially.
As of the end of the year, which is the most recent balance sheet we have for American Airlines, the firm had a cash position of $7.618 billion and current assets of $13.154 billion. These are both post-2020 (COVID-19 era) lows for the firm. Current liabilities ended the year at $24.295 billion, maybe the highest record for the firm, as I only went back to 2015 on this. $5.19 billion of that was in the form of short-term debt, which is dangerous. Unearned revenue, which is not a true financial obligation, came to $10.315 billion.
That left the firm with a headline current ratio of 0.54, which is awful. When adjusted for those unearned revenues, the ratio rises, but only to 0.94. For those who never took any accounting classes, a current ratio of less than 1.0 puts a firm's ability to meet its short- to medium-term obligations in question.
Beyond that, the firm had total assets of $61.783 billion and total liabilities of $65.76 billion, of which a whopping $24.623 billion is in the form of long-term debt. The above-mentioned Brien wasn't kidding. There's a bit of leverage present on this balance sheet. At least management wasn't stupid enough to return capital to shareholders.
American Airlines Earnings
American Airlines is expected to report the firm's first quarter financial results on or about April 24. That's a little more than two weeks out. Consensus is for an adjusted EPS of -$0.67 on revenue of almost $12.6 billion. That would be down from the year-ago comp of -$0.34 on roughly flat sales growth. I have found eight sell-side analysts that cover AAL. All eight have cut their estimates for the quarter for this firm since the start of said quarter.
The American Airlines Stock Chart
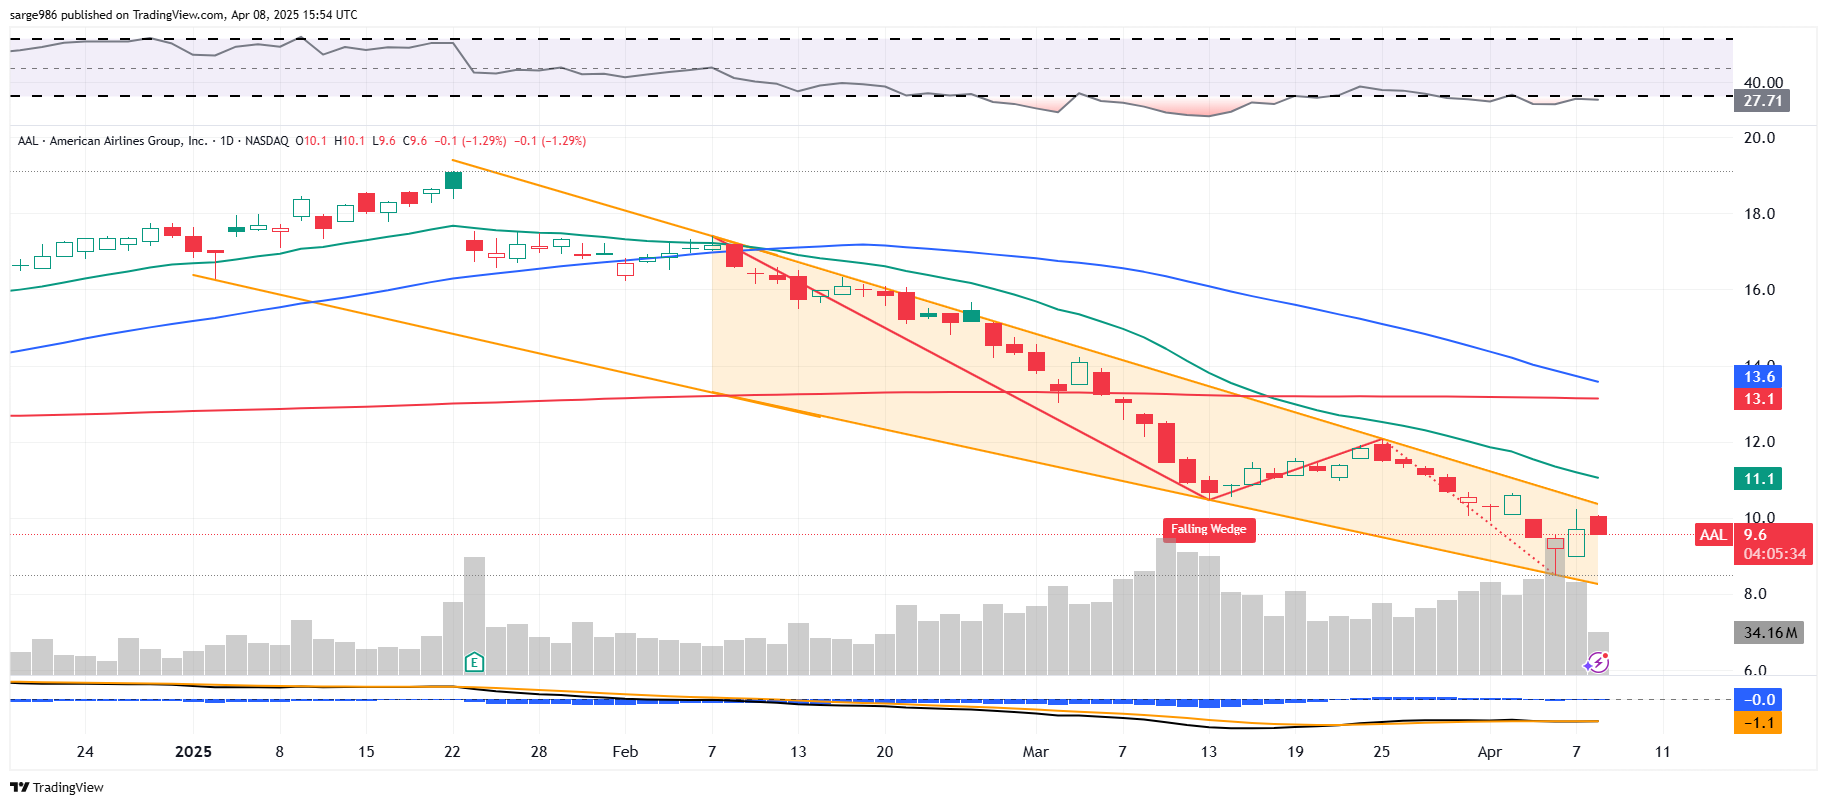
AAL has been in a fairly clearly defined falling-wedge pattern which is a pattern of bullish reversal. Relative strength has been awful for two months as has been the daily MACD. Investors and traders will have to watch for the imminent "death cross" when the blue line (50-day SMA) crosses below the red line (200-day SMA).
If the stock (the firm is still a fundamental mess) can avoid trading below last Friday's low of $8.50 in algorithmic response to that event, there could be a long-side trade (note: I did not say "investment") here. In the event that this setup plays out, the pivot becomes the 21-day EMA (green line). This is a modest trade idea for a tough environment. If the stock makes a low lower than $8.50 after the death cross, the deal is off.
At the time of publication, Guilfoyle had no positions in any securities mentioned.
