Sure, a Rally's Possible, but I'd Rather See Downside First
Downside would get many sentiment indicators to an extreme.
You've reached your free article limit
You've read 0 of 1 free Pro articles.
The Market
Let’s talk about sentiment.
Anecdotally, I want to scream that every guest on television cites “seasonality” as a reason to be cautious. That means either we are not going to correct or we are going to have to correct a lot more than they want, even to get them to get really scared.
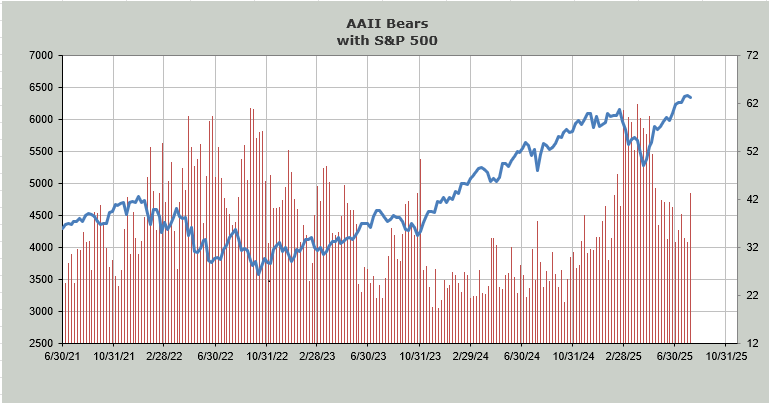
Today we saw a major divergence in sentiment. The AAII bears jumped 10 points to 43.2%. This is the first time since June that there are once again more bears than bulls (the bulls are at 35%).
Then there is NAAIM, which got quite bullish. It is my contention that when the Mag-7-type names do well, the NAAIM folks are happy to increase their exposure. When those megacaps lag, they pare it back. They have lifted their exposure this week to 63. In early July they were kissing 100.
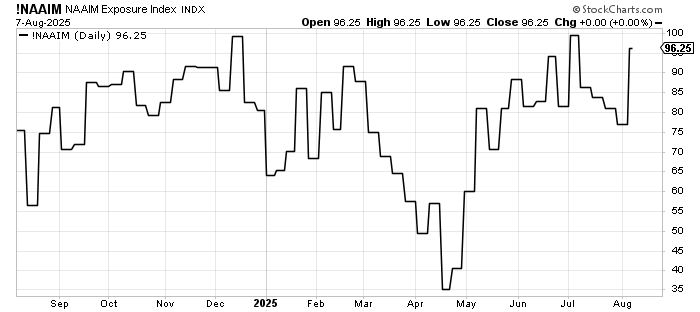
So we have the old people (AAII) bearish and the momentum chasers (NAAIM) bullish.
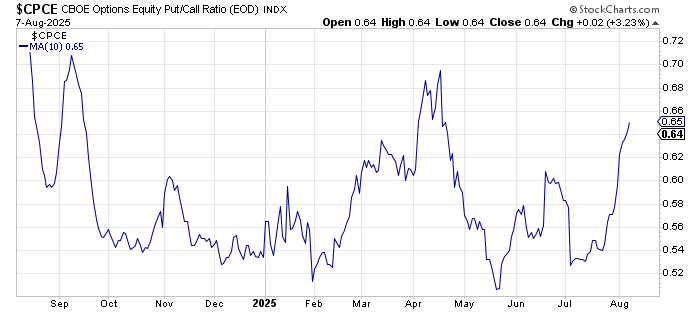
Then there is the put/call ratio. Today it came all the way down to .78, which is the lowest reading since July 18. But when we look at the 10-day moving average of the equity-only put/call ratio, we see it has already surged from .52 to .65 since early July. It is now closing in on the peak reading from April.
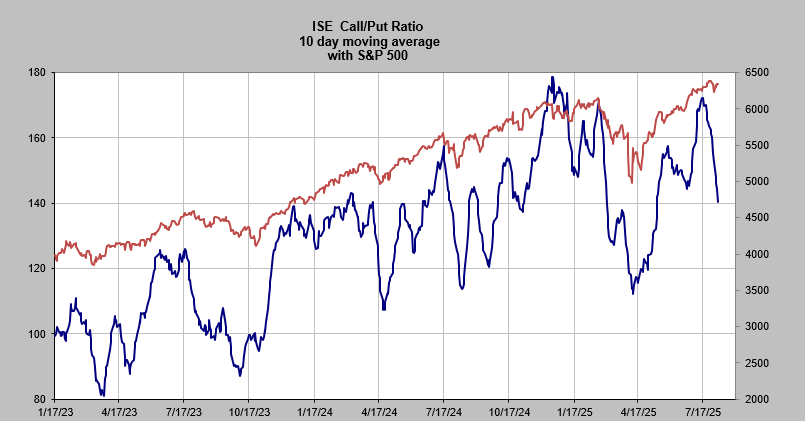
Even the ISE call/put ratio, where we seem to have a lot of small trades, and where the call buying has seemed almost endless this whole year, we have seen a major pullback. And that’s with very little movement in the S&P. The chart is below.
All this is to say that I can easily see stocks rallying for a few days, but I would prefer some downside because downside would get most of these sentiment indicators to an extreme.
New Ideas
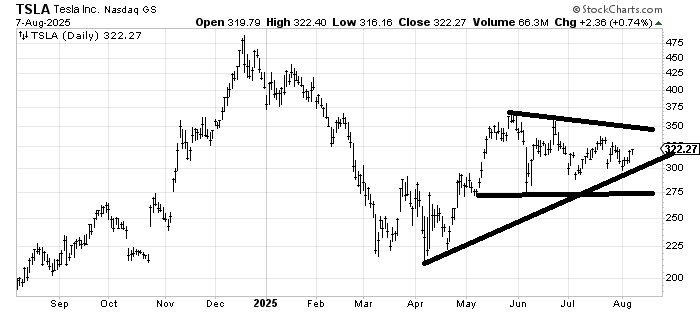
I was asked if I had changed my view on Tesla TSLA, which is that it is trapped in a range, so when it comes down you buy it and if it can get back to the top of the range, we’d probably sell it.
Today’s Indicator
The ISE call/put ratio is discussed above.
Q&A/Reader’s Feedback
Helene welcomes your questions about Top Stocks and her charting strategy and techniques. Please send an email directly to Helene with your questions. However, please remember that TheStreet.com Top Stocks is not intended to provide personalized investment advice. Email Helene here.
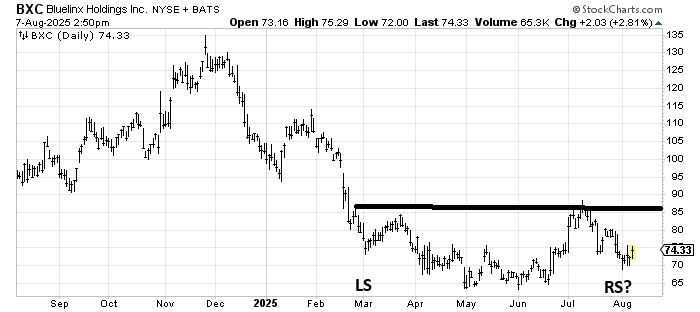
I am definitely intrigued with the chart of Bluelinx BXC, except that it trades by appointment. But this feels like a chart trying to bottom. When we get oversold again, this should be one to watch as long as it stays over 65-70.
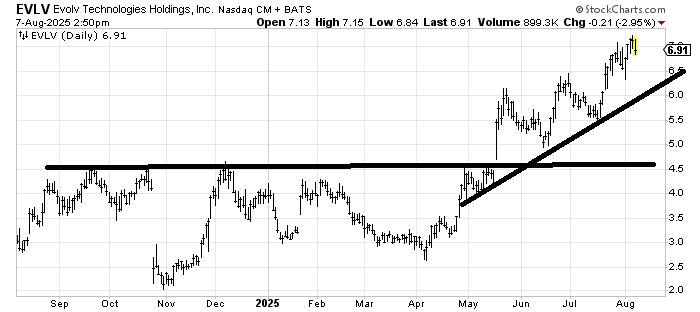
Evolve Technologies EVLV has a measured target in this 6.5-7 area but it hasn’t done anything wrong yet. If you bought it, well, you can take a few profits, but otherwise as long as it stays over that uptrend line, it should be fine.
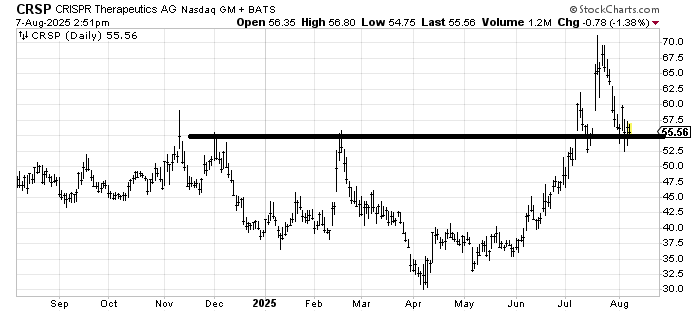
I hesitate to buy a biotech these days because health care in general has been so bad. But as far as risk/reward goes, if Crspr CRSP can stay over 52, then it ought to be okay.