Support Held for Now, So Let's Take Stock of Some Key Indicators
A huge oversold bounce today indicates that support held. What's next?
You've reached your free article limit
You've read 0 of 1 free Pro articles.
The Market
Now that’s an oversold bounce. I could complain about such things as volume or the fact that it didn’t change any of the indicators or that the charts all look the same: support held for now. But let’s note some other interesting tidbits.
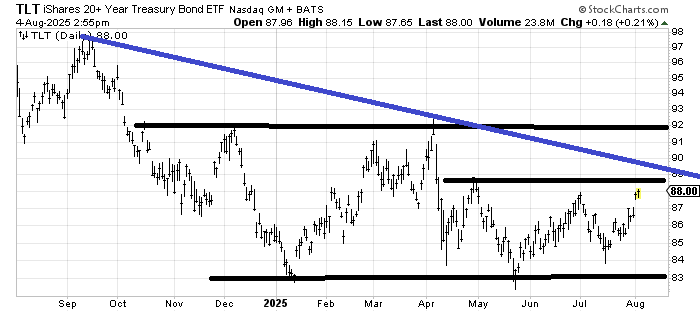
Bonds. They barely budged today, but the Utes soared (again) to a new high. They are now green for five straight days, so they ought to pull back before the week is out. But down below, you will see I was asked about TLT (my view has not changed: still think we’re in a wide range). One thing I did not note is that the DSI for Bonds is now 72. That is neutral to me. However, should TLT make it to 89 I imagine the DSI will be over 80. I will keep an eye on that for you.
Upside volume on the NYSE (and Nasdaq) tried all day to get over 80% but even though the major indexes all filled their Friday gaps (down) both exchanges had only 79% of the volume on the upside. Over 80% would be considered bullish. It’s not as though under 80% is bearish, it’s that it’s just not anything to write home about.
Speaking of volume, both the NYSE and Nasdaq had the lowest volume since June 6th. You will not find me complaining about light volume on rallies because that tends to be a hallmark of this market. However, I would note the penny stock folks took a holiday because Nasdaq’s volume was a mere 7.5 billion shaers.
Here’s another oddity. The ISE call/put ratio for equities has regularly been over 2.0 since April. We’ve had a day or two here or there with readings under 2.0. On an up day like today it has often been over 2.0. Today it was 1.66. I wish I could tell you it screams bullish or bearish but all I can say is that the various moving average lines are all heading down (generally not bullish).
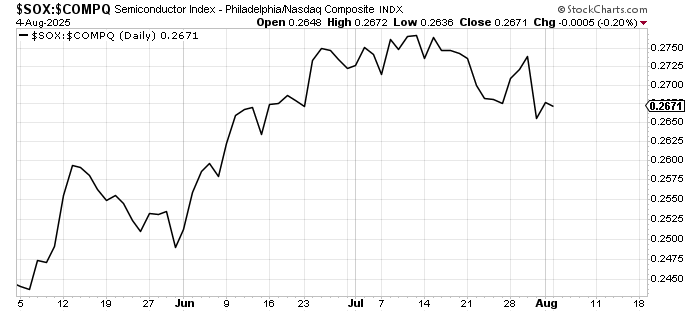
Here’s another change. The SOX underperformed Nasdaq today. Not by a lot but it did not lead.
I would not be surprised to see the market give back some of its gains in the next few days but we’d still be short term oversold enough to rally again later in the week if it did that.
New Ideas
Last week I said that if GLD breaks 300 then rallies back I would find that negative. It did not break 300 so I will stick with my view that unless/until GLD breaks 300 it gets the benefit of the doubt.
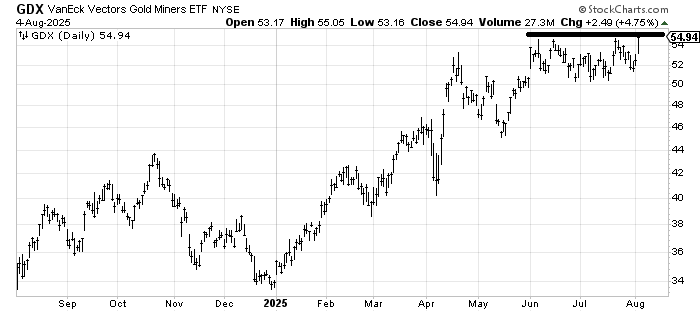
However GDX is on the verge of breaking out. Some have said the stocks lead the metal but I have never seen a great correlation. However since I was asked about GDX, let me say a breakout here would put a next measured target near 59-60.
Today’s Indicator
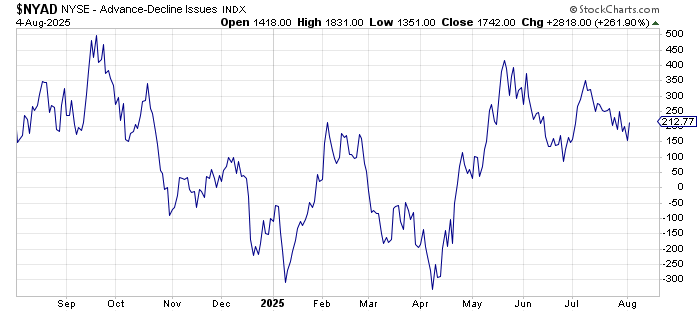
The 30-day moving average of the advance/decline line is still overbought.
Q&A/Reader’s Feedback
Helene welcomes your questions about Top Stocks and her charting strategy and techniques. Please send an email directly to Helene with your questions. However, please remember that TheStreet.com Top Stocks is not intended to provide personalized investment advice. Email Helene here.
I seem to have confused folks on my view regarding bonds. I still think rates will be mostly between 4 and 5%. Sometimes we will go outside of the range for a bit but mostly that’s what I see. When it comes to TLT you can see the range on the chart. 89 is going to be resistance and after that 92-ish. I do not think I have changed my view in a few years because rates have mostly been in that range for nearly three years.
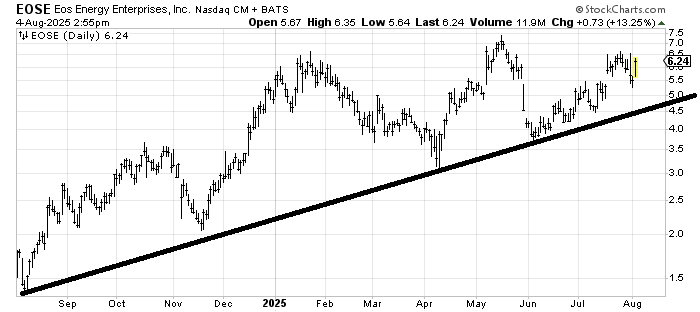
Eos Energy EOSE scares me because it has a look of a potential head and shoulders top if it can’t get through 6.50. However the trend is up and unless/until it breaks 4.50 it hasn’t done anything wrong. I actually like that it filled that gap last week
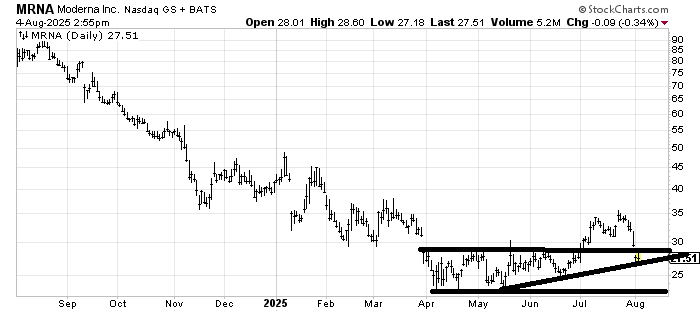
This is an important area (27-ish) for Moderna MRNA because if it can hold here it will improve the base it is trying to build. The base is still quite small and there is no clear cut breakout. I do not want to see it back down near 23 since I would not view that as bullish.
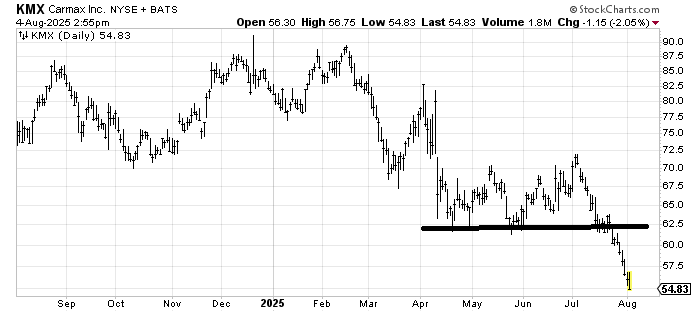
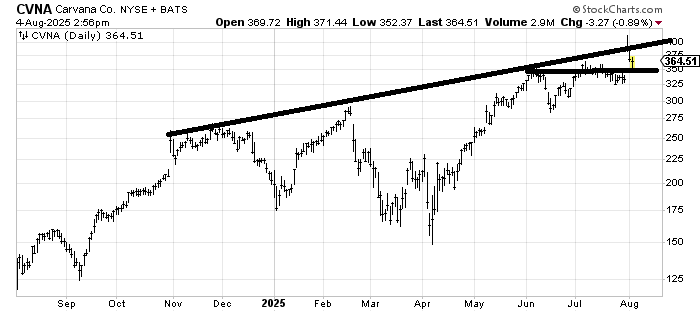
I am told Carmax and Carvana are in the same business. I look at their charts and I wonder how that can be. The only explanation I have is one is a hot stock CVNA and it has nothing to do with its business and maybe KMX tells us what the business is really like (not great). And maybe folks keep shorting CVNA because they see KMX?
The only good news I have for KMX is that there is a measured target in the low 50s and the stock is getting mighty oversold so it is due a bounce.
CVNA hasn’t done anything wrong. It could easily just ride that upper line (which is high and rising) as it did in November and most of December.
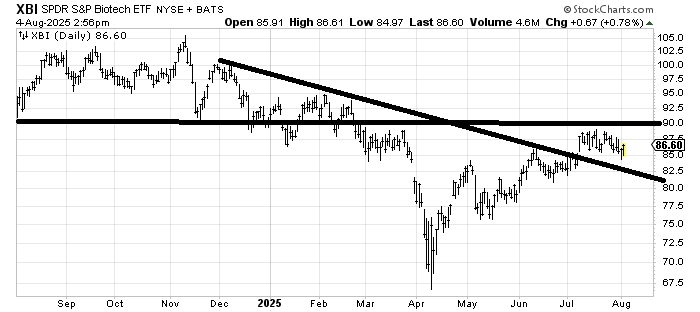
XBI is trying to chew through all that resistance. I don’t think it does so in one bite but rather over time and that probably means there will be a correction at some point. The pattern is not exciting but it’s not dire either. It feels like patience is required; the good news is the selling last week was quite contained.