Stocks Will Bottom if Volume Really Explodes
What we want to see is a washout, where investors throw in the towel.
You've reached your free article limit
You've read 0 of 1 free Pro articles.
The Market
The longer this goes on, the further the intermediate-term indicators get pushed toward an oversold condition. But they are not there yet.
The Nasdaq Hi-Lo is at .15, so that has gotten there. I showed the chart yesterday. It got down to .04 in the fall of 2023, to give you an idea.
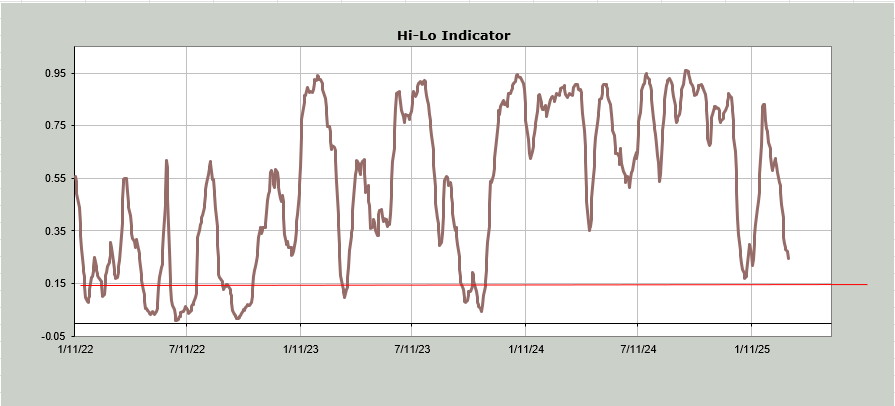
The NYSE Hi-Lo Indicator is at .25. That gets oversold under .15, so it is not there. To put it in perspective, it was at .19 in January, and it, too, got to .04 in the fall of 2023.
The Volume Indicator, which I will show here tomorrow, is still at .48. It was lower in January as well. And in the fall of 2023, it was in the low 40s. The 30-day moving average of the advance/decline line (shown here yesterday) looks oversold, but the math behind it says, not so fast. To get it oversold we have to look back to see that we are dropping a very long string of negative breadth days.
As I have noted, breadth has not been horrific, certainly not the way it was in December. In fact, we have not had more than two consecutive negative breadth days in more than two weeks. Heck, the major indexes haven’t had more than two consecutive red days since this began in late February. Since then, we have had a reprieve on the third day.
We have now had two negative days in a row, so if the pattern of the last few weeks holds, Wednesday should be an up day.
But let’s talk about something else: volume. We’ve discussed Nasdaq volume quite a bit; now, let’s focus on the NYSE. Volume has been on the rise there, too, although not in an explosive way. My view on volume has always been that we can rally on low volume, but high-volume declines tend to clean things out, and they are standard (see the QQQ volume discussion from yesterday).
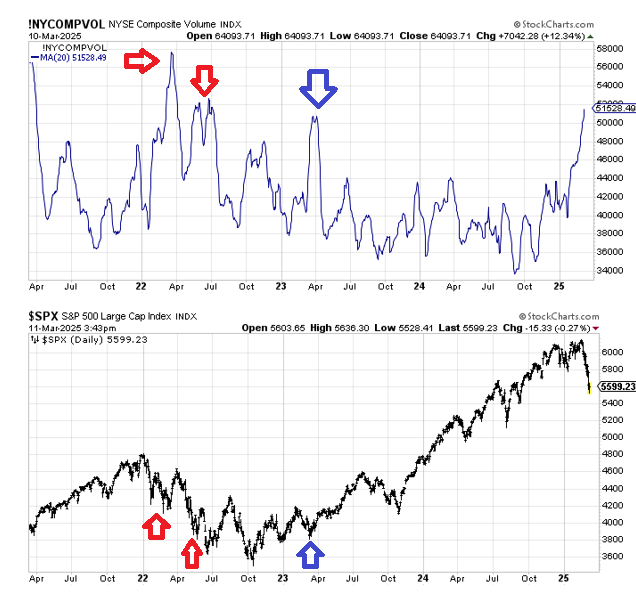
The 20-dma of NYSE volume is now at 5.1 billion shares which is the highest since early 2022. You can see the Silicon Valley Bank blow up in early 2023 (blue arrows) but let’s look at early 2022.
The initial high volume move to 5.8 billion shares came in March of 2022 (red arrow). We had a rally off of that and came down again to a lower low on the S&P. But volume was easing up a bit on that second leg down (more red arrow). By the time we got the low in October of 2022, we were at a lower high in volume again. The selling just petered out. You might recall everyone was looking for a big move in the VIX that they never got.
My point here is that this rise in volume is ultimately bullish (folks are selling, and you can’t start buying until you have sold), but you can see the process that must take place: rallies, then down again (on some more selling, possibly less volume), etc. In my view, this market acts more like 2022 than the SIVB blow-up in the spring of 2023.
New Ideas
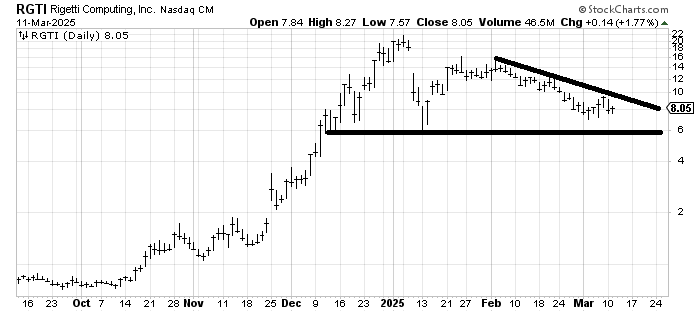
I want to follow up on Rigetti Computing RGTI, a name I was asked about a few weeks back. I was not bullish on the chart, but I have noticed that it hasn’t made a lower low in a week. I still see good support at 6, but if it can hold over last week’s low (7-ish) and then cross that downtrend line, that would make the chart much more interesting.
I still believe the best way to play for a short-term rally is in an index.
Today’s Indicator
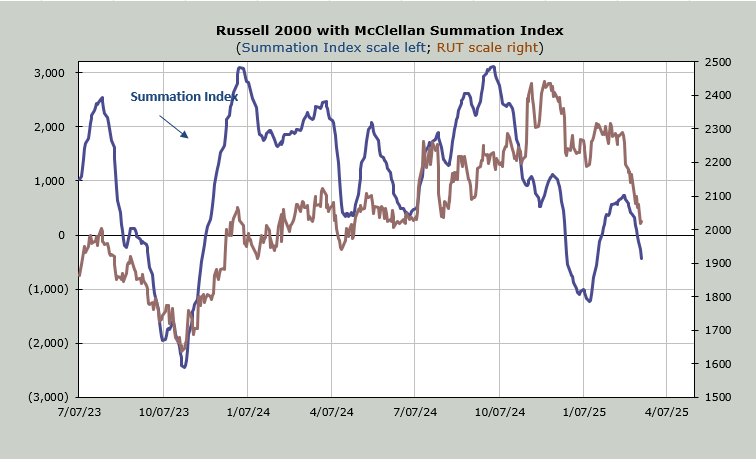
The McClellan Summation Index is still heading down and would require a net differential of +2700 advancers minus decliners on the NYSE to halt the slide.
Q&A/Reader’s Feedback
Helene welcomes your questions about Top Stocks and her charting strategy and techniques. Please send an email directly to Helene with your questions. However, please remember that TheStreet.com Top Stocks is not intended to provide personalized investment advice. Email Helene here.
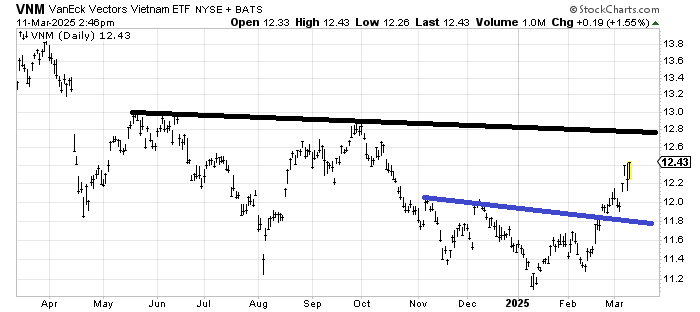
VNM, an ETF to be long Vietnam is trying to build a base. That little base (blue line) measures to that 12.6-12.80 area so you probably will need some patience with this. It probably gets there and pulls back before heading up again.
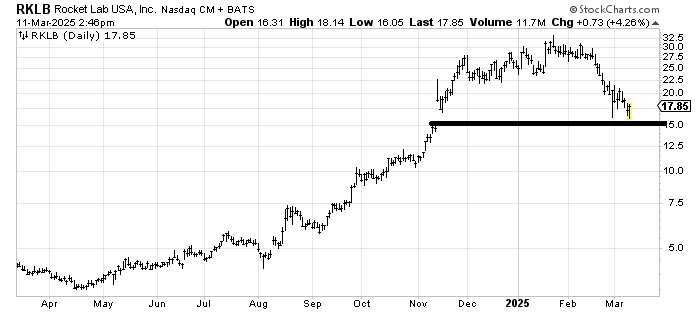
Rocket Lab RKLB didn’t quite fill the gap from November, but it did meet its measured downside target. As long as it stays over 15, it ought to attempt a rally toward 22-ish. If it can’t get over 20, I’d get quite concerned.
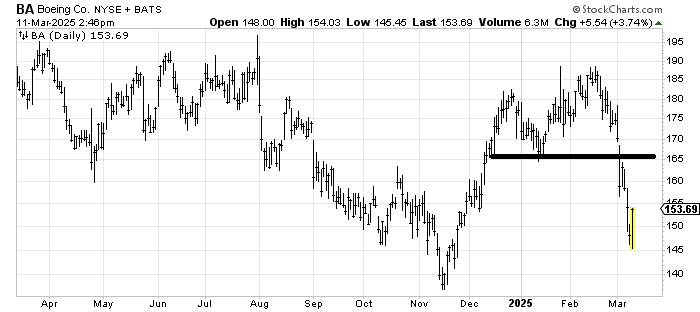
I had thought Boeing BA would come down to the 160-165 area before holding and turning upward again, but it sliced through that support readily. It ought to rally back to that 160-165 area now.