Stocks Have a Pathetic Bounce, but Some Things Have Changed
Let's look at several key indicators to see how the current market compares to 2022.
You've reached your free article limit
You've read 0 of 1 free Pro articles.
The Market
I know; it was a pathetic bounce. No doubt about it. But let’s explore what changed.
First of all, so many are looking for an oversold bounce, that I feel I have far too much company. Yet, action like today isn’t going to inspire anyone to play for it. That’s good for the sentiment front.
What else changed? On the positive side, the Russell 2000 had its first consecutive green days in more than a month. Think about that: this index has not managed to put together two up days in a row in five weeks and while the rallies were puny, they happened. That’s a minor change.
What else changed is that the Transports are now at a 52-week low. Everyone is hootin’ and hollerin’ about the S&P only being down ten percent, yet the Transports are at a new low. That is not bullish.
Bonds. On a good CPI print, they fell (rates up). That is not good.
The Utes. They have been sloshing around for weeks now and feel vulnerable to a downside move.
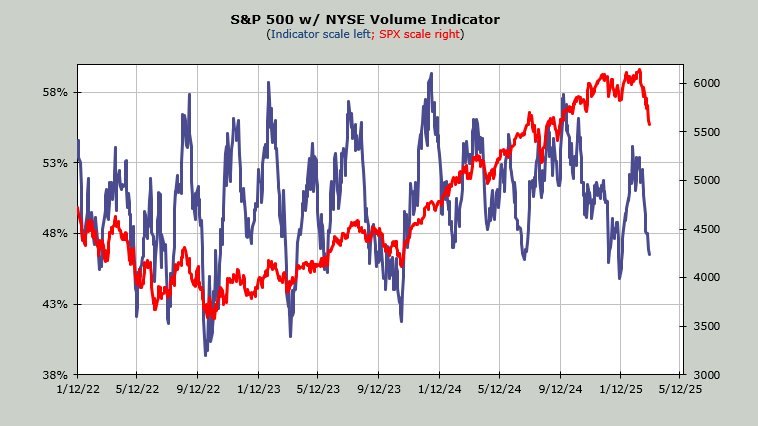
Some other updates include the Nasdaq Hi-Lo is now at .14 while the NYSE’s edged down to .23. For the NYSE oversold is under .15. Down below you will see the Volume Indicator at 48%. Oversold is at 47% in a bull market and lower (42%-ish) in a bear market. Based on the math I suspect it goes lower than 47%.
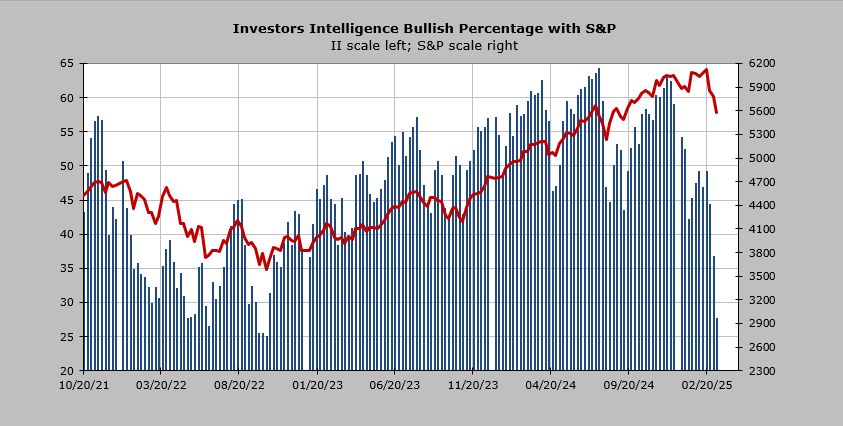
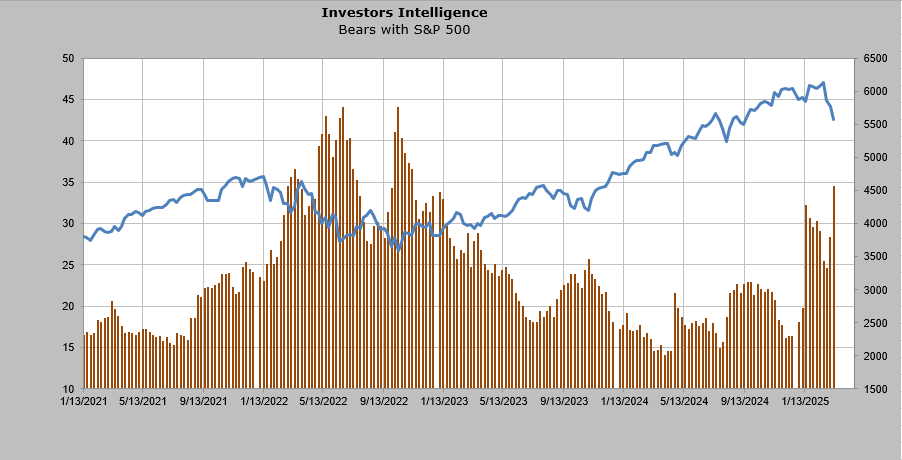
But let me now offer the best news of the day: the Investors’ Intelligence bulls sunk like a stone. Bulls now chime in at 27.6% while bears are at 34.5%. This is the first time we’ve had more bears than bulls since November 2022. That is bullish.
There is, however one caveat. We also had more bears than bulls in the spring of 2022. As we discussed last night, we rallied and came back down. By the time the fall of 2022 came around, we’d been in a bear market for ten months already. By the time the fall of 2022 came around all my indicators were grossly oversold. We are only a month or less into this decline, which is why the indicators are not as oversold as they were in the fall of 2022.
New Ideas
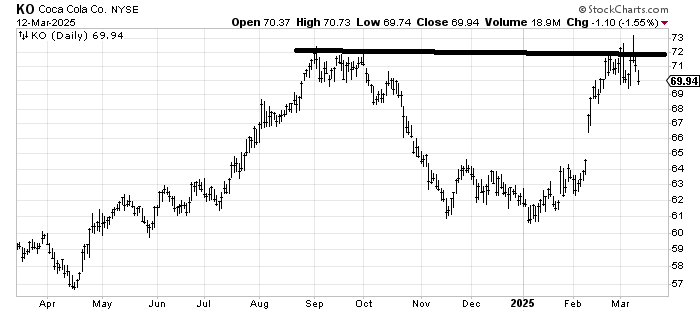
We had a nice run in Coca-Cola KO from January, but we’ve given it ample time to get through 72, and it has been unable to do so. It’s time to part ways with the stock. It looks vulnerable.
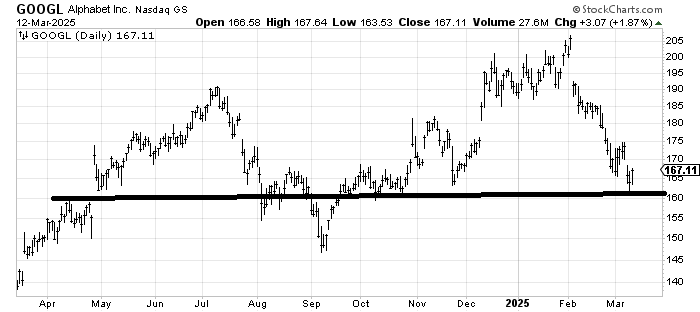
There are very few reasons to like Alphabet GOOGL down here, but it is at support. If the stock, for some reason, gaps up over 170, it could leave this area down here as an island (bullish).
Today’s Indicator
The Volume Indicator is at 48%
Q&A/Reader’s Feedback
Helene welcomes your questions about Top Stocks and her charting strategy and techniques. Please send an email directly to Helene with your questions. However, please remember that TheStreet.com Top Stocks is not intended to provide personalized investment advice. Email Helene here.
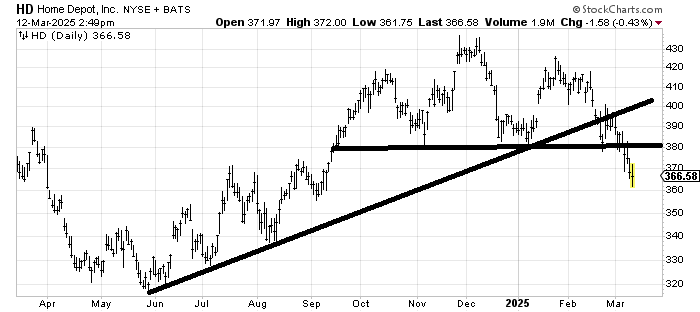
Home Depot HD looks like a classic head and shoulders top that ought to eventually measure to 330-ish. It’s always difficult when there is a head and shoulders top that is so obvious because they tend to be too obvious. Right now, it is oversold, and I would expect a rally toward the 380 area. If it fails there, that does put 330 in play.
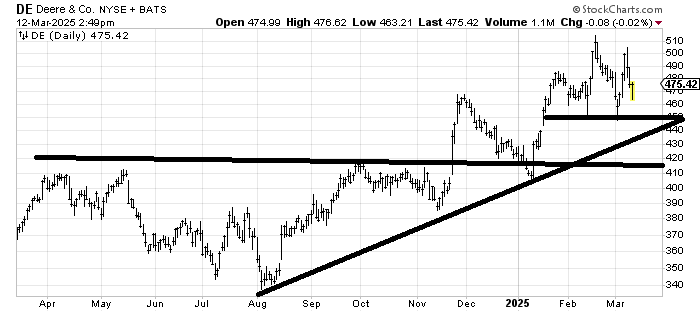
My issue with Deere DE is that it has met its upside target from that base. It’s going to need some sideways action before I can look for it to do much more than this. There is good support in the 440-450 area, so if it doesn’t break that, it should be okay.
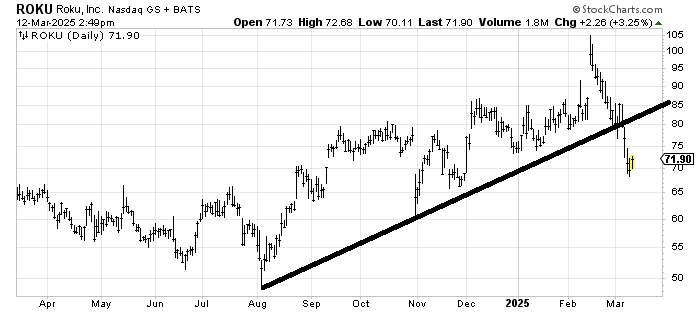
Roku ROKU sliced through support like a hot knife through butter. It’s got support in this 65-70 area, but for the time being, I’m inclined to sell rallies, especially if it can get up near 80.