Stocks Are So Oversold, They're Hungry For a Rally. A Short-Term Rally.
Stocks are looking for an excuse to move up. The problem is that they're not yet intermediate-term oversold.
You've reached your free article limit
You've read 0 of 1 free Pro articles.
 Wall Street Lead (RD 101425)
The Market
The market has always moved on headlines, and this point in time is no exception. Just look at Thursday afternoon when the market, so hungry for a reason to rally, went up on the mere speculation we might see an end to this war.
And I don’t expect this week will be any different. The market is short-term oversold and therefore ripe to rally on any resolution or even whiffs of resolution to the war.
I realize some folks will think, but we were oversold last week, and we didn’t rally. Yet let me point out the banks were up on the week. Oh, it might not have felt it, but up they were. The SOX was up on the week. Yes, I know NVDA was not, but the Semiconductor Index was.
You know what else was up on the week last week? The Transports. Wait, how can that be if oil is surging? They are clearly the one group that hates higher energy, right?
I can’t explain it because I am really terrible at narratives. But I can tell you that there was a respite in the selling in several areas last week. We will probably see something similar this week.
We are oversold short-term (not intermediate-term). Sentiment is bearish but not extreme. You’ve seen my list of extreme sentiment readings, but let me take a minute to report that the DSI for the S&P is now 22 (Nasdaq is 25). This is the lowest since April last year, when it got to single digits. You may see folks citing this as extreme. In my view, it is not yet extreme.
I might consider a move into the teens extreme, depending on other indicators (like if we were intermediate term oversold), but my view on the DSI is that a reading under 15 is a flashing yellow light (get ready) and a single digit reading is a ‘let’s buy something’ (extreme). But know that it tends to be a lot easier to get from 40 to 20 than to get from 20 to 9. That last ‘mile’ is typically the hardest one.
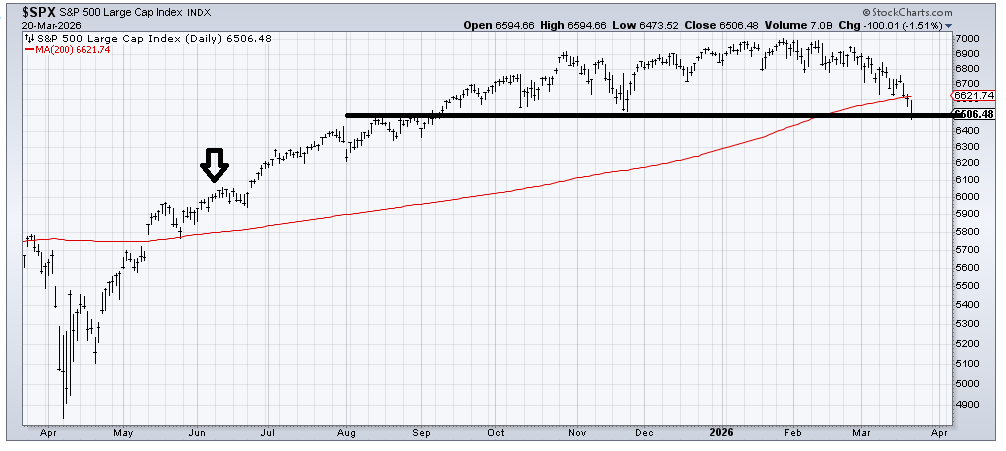
One other point I should make is the 200-day moving average line. Most of the major indexes are now below theirs. That is generally not a great place to be. Two hundred trading days ago was early June (arrow on the chart), which means, for now, that the moving average line is still rising. It is much easier to recapture a rising moving average line than it is one that is rolling over. Unless/until the indexes trade under where they were 200 days ago, the moving average will continue to rise.
Also, the S&P has come right down to support at 6500. Since last fall, it has refused to break it. Since I think we are short-term oversold, we will probably rally off it. If we cannot recapture 6620 in a hurry (the 200 DMA and resistance), then I would expect the next time down, we break 6500. Maybe that would bring us some extreme readings and some intermediate-term oversold conditions.
New Ideas
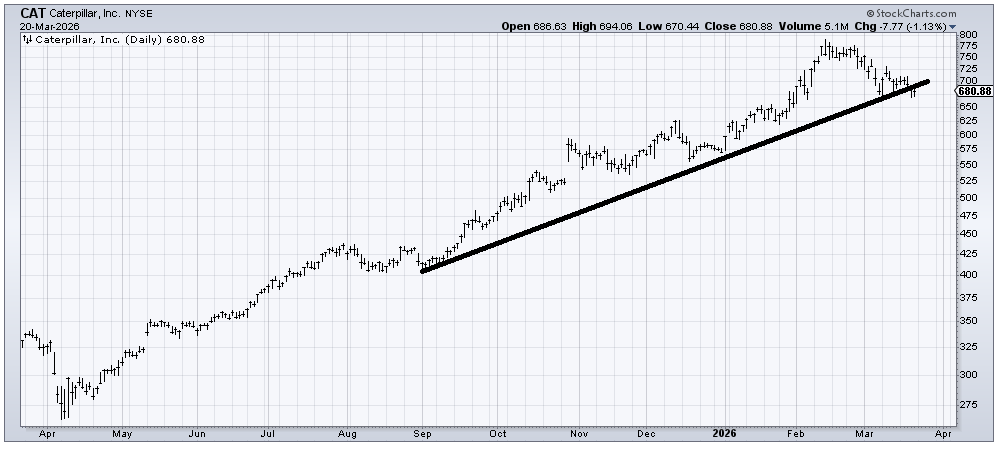
Last week, I said I didn’t like Caterpillar (CAT) breaking this line. It broke, but then did nothing. And it continues to trade over 680, the prior low two weeks ago. It may rally in an oversold rally, but I think over the next few weeks, this is likely to break 680.
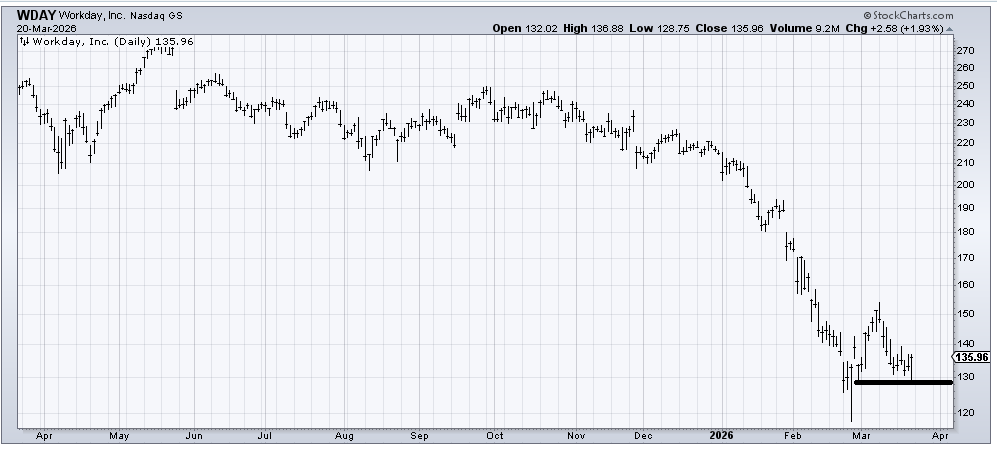
I suspect the move in Workday (WDAY) on Friday had more to do with the quarterly rebalancing, but as long as it stays over 130, I would give it a chance to have an oversold rally this week.
Today’s Indicator
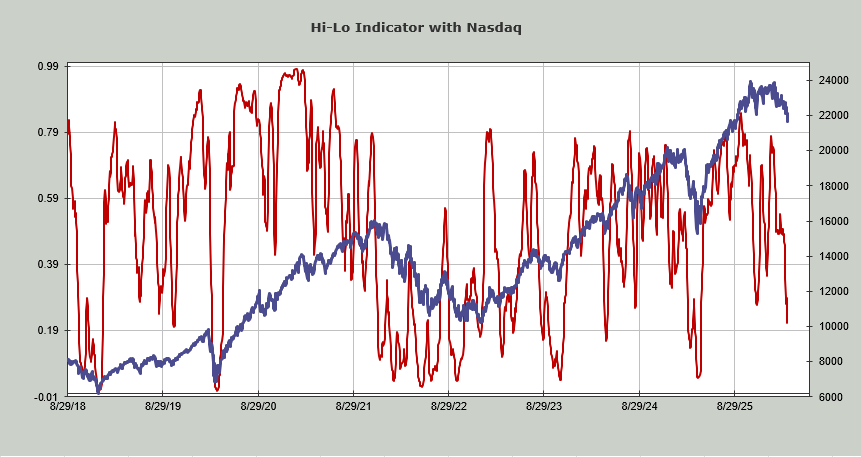
The Nasdaq Hi-Lo Indicator is now at .21. So it is getting close to an oversold condition. The NYSE is still far away at .34.
Q&A/Reader’s Feedback
Helene welcomes your questions about Top Stocks and her charting strategy and techniques. Please send an email directly to Helene with your questions. However, please remember that TheStreet.com Top Stocks is not intended to provide personalized investment advice. Email Helene here.
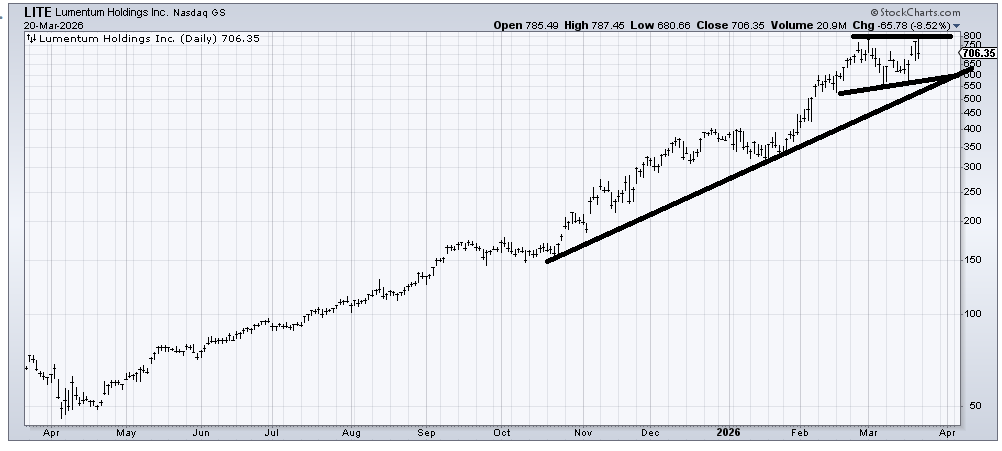
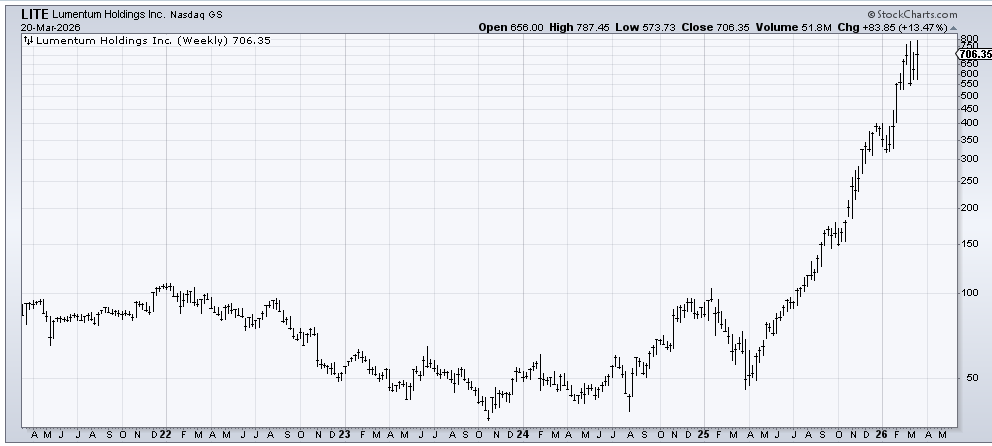
Lumentum (LITE) was a chart I was quite bullish on back in 2023-2024 because of that big base (seen on the weekly chart). Of course, after it rallied to 150 (doubled from my initial recommendation), I thought it had seen enough, so I went from really smart trade to really dumb trade when it proceeded to soar after 150.
That having been said, it hasn’t done anything wrong yet. There is resistance at 800 and support around 575. I would not be shocked to see it trade back down to support. A break of support would signal trouble.
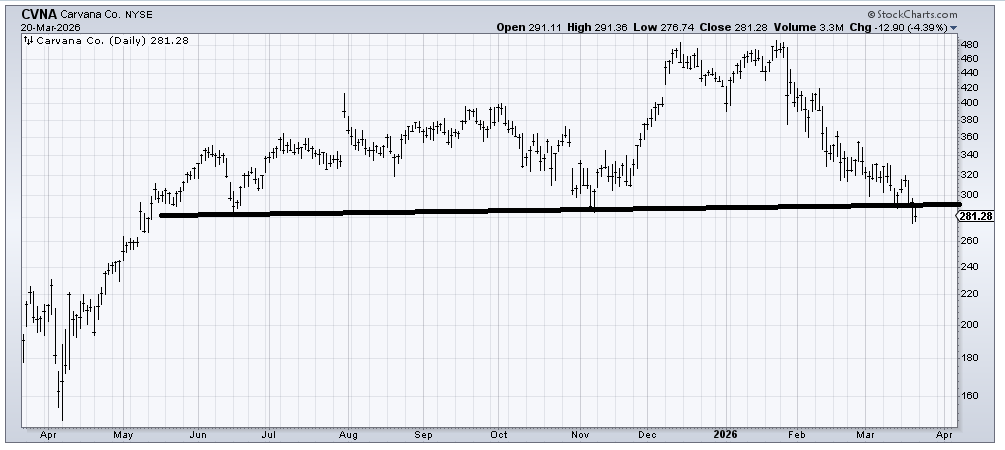
Carvana (CVNA) has broken down. Maybe it’s short-term oversold here, but unless it can recapture 295 in a hurry, I’m inclined to think the next few months will see it lower. The exception is if we see all the indicators show extremes, and therefore the whole market gets oversold and too bearish.
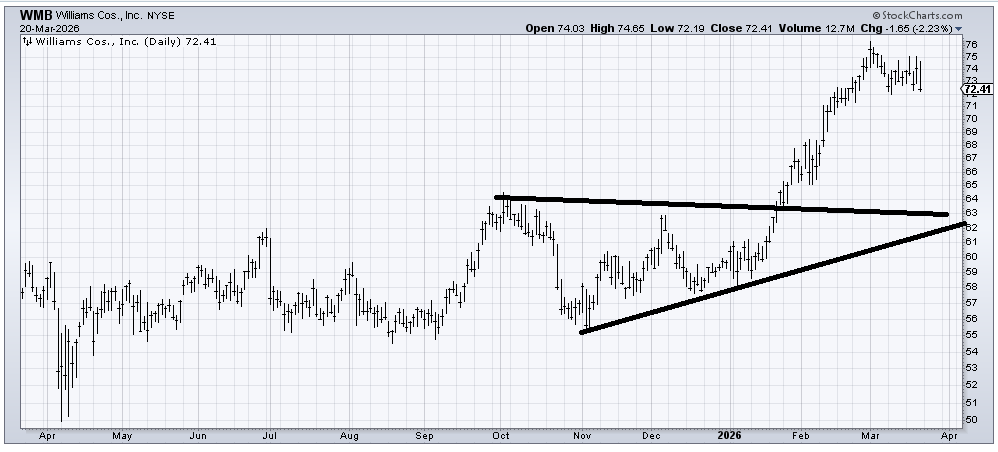
Williams (WMB) seems vulnerable to me should it break 72. Should it come back down into the mid 60s and set up another pattern, I might like it again, but up here, I am a profit taker, especially if it breaks 72.
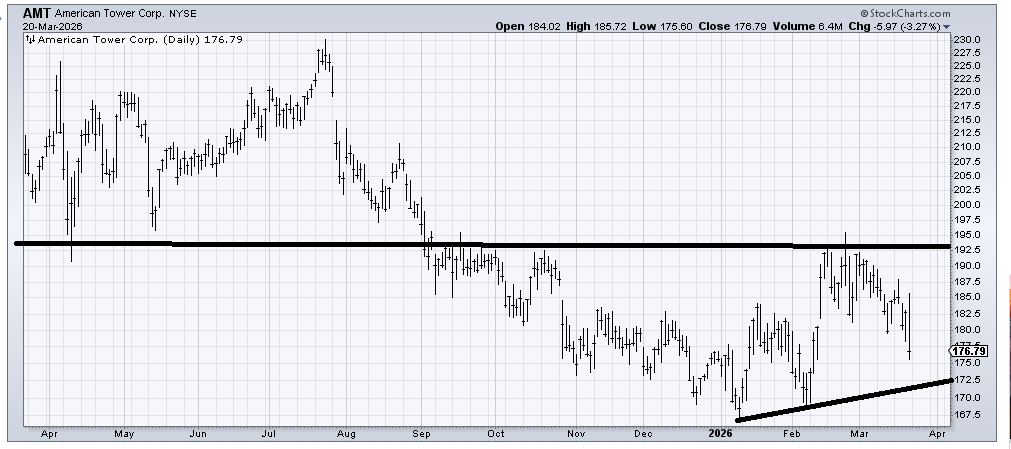
I don’t like that American Tower (AMT) has given up so much of the gain from February because it appears to be trying to form a base. In fact, a push down to that line and then a rally and some more back and forth for a few more months would make this a very interesting base. It’s early, but I would put it on the radar.
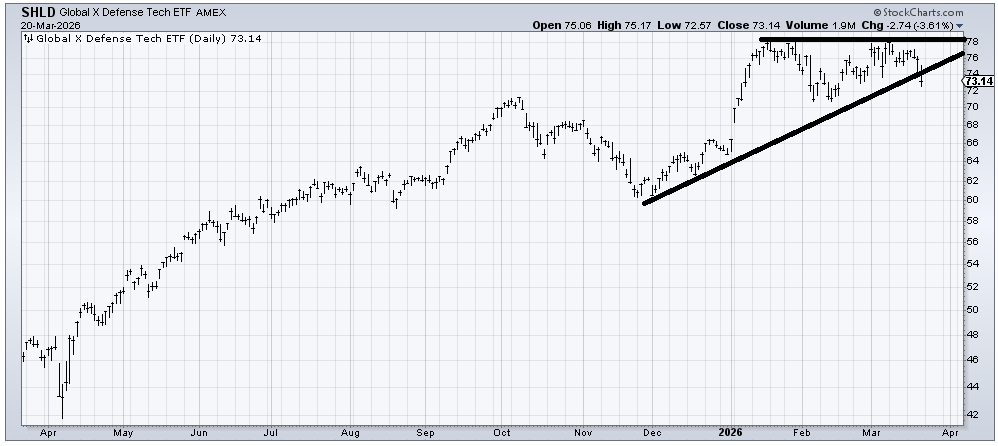
SHLD (SHLD) is an ETF to be long the Defense stocks (it also used to be a ticker for Sears!). Despite the war, the defense stocks have acted poorly. This looks like a top to me. I suspect it bounces off that 70-71 area (February’s low), but unless the whole market sets up for a big rally, I’d stay away from this now.
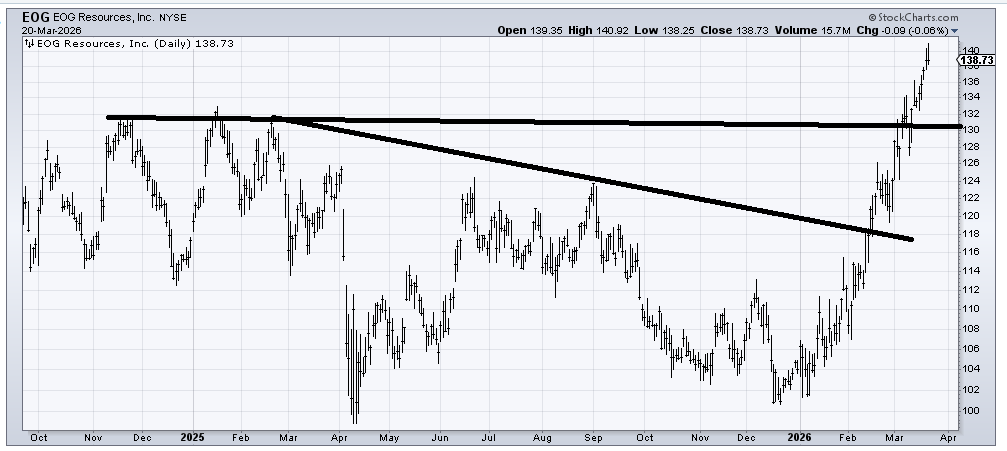
I spent much of the fall bullish on EOG (EOG) , but I am not interested in buying it now. It is over-extended and stretched. A pullback into that low 130s area would be a place of interest to have another look at it again.
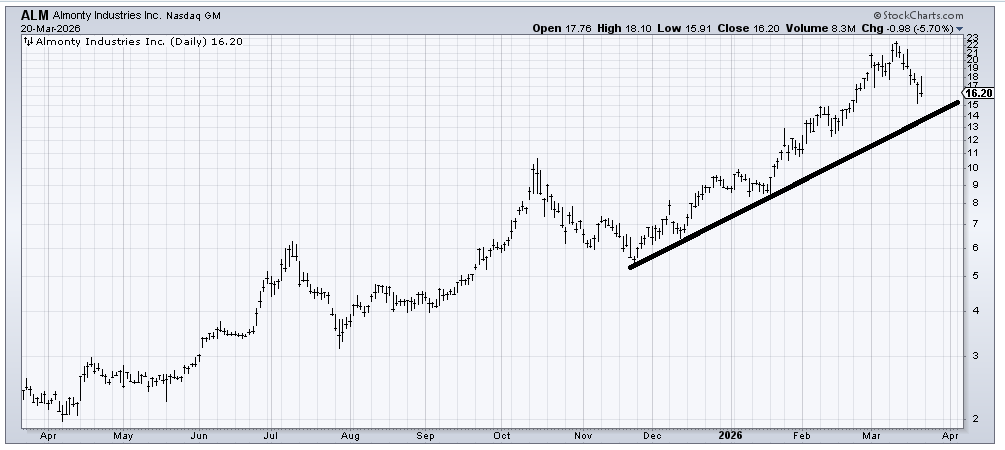
Almonty (ALM) hasn’t broken anything yet. I suspect it will bounce off that line. The problem would arise if/when a bounce is pathetic and can’t rally well. So, if it bounces off 14 and can’t get back over 17, that would be problematic.
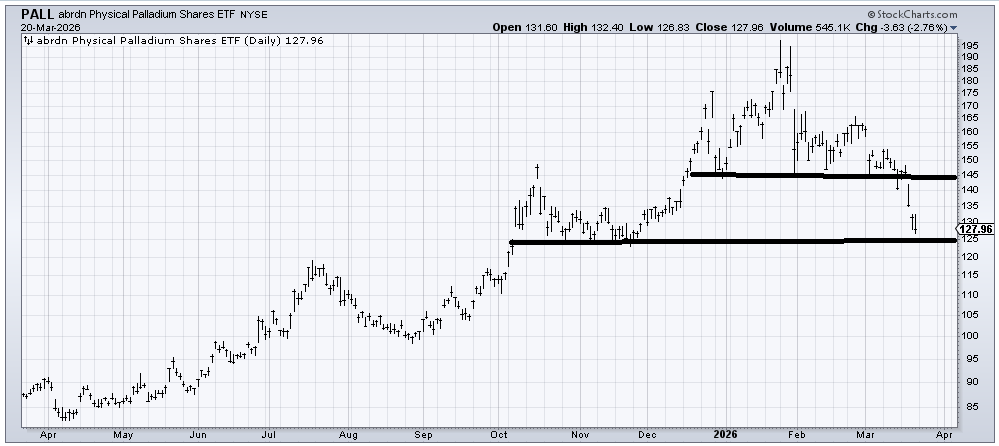
PALL (PALL) is an ETF to be long Palladium. It broke down at 145, and so it is getting short-term oversold (and at support), so if it can rally to anywhere in the 135-145 area, I’d sell it.