Stock Picker’s Market? Early 2026 Feels All Over the Map.
From the S&P’s gains to a stubborn VIX and under-owned energy stocks, here’s what’s driving the market’s choppy start.
You've reached your free article limit
You've read 0 of 1 free Pro articles.
The Market
Today’s market was about as ‘all over the map’ as Friday’s was. For example, breadth was good, but it was the same as it was on Friday. Today, the S&P was up 43, and Friday it was up 12 points.
Friday’s up volume was 71% on the NYSE. Today was 67%. And then there is the VIX. It was green all day. It never gave it up.
Bonds were up, yet the Utes were down, much to my annoyance. The Transports tried so hard to make a higher high and give us a Dow Theory confirmation, but in the end, they fell short by a few points.
Basically, today—and Friday—so the first two days of the year felt like a market of stocks, or a stock pickers market.
And all those ratios we looked at yesterday barely budged, so they told us nothing either.
The bottom line for me is that I would love to see the market shakeout in the next few days and get us an oversold condition. The action in the VIX just makes it feel like we need a shakeup.
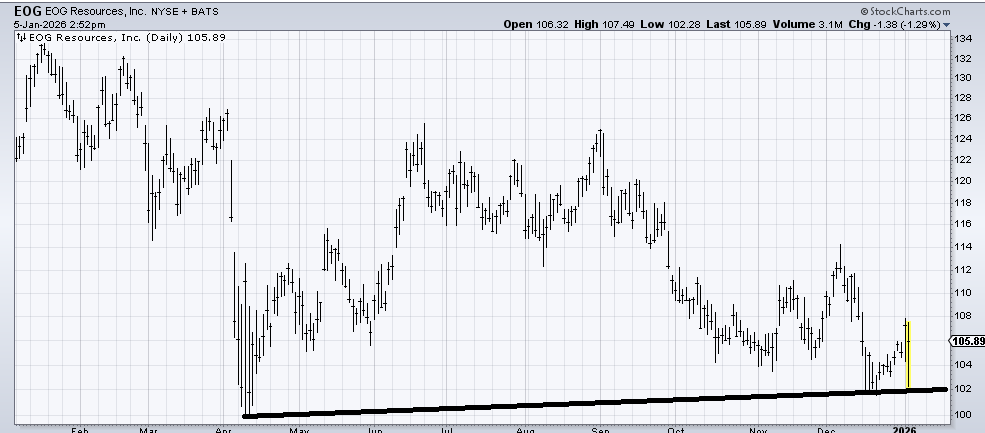
And what of energy? As you know, I have been a fan of Exxon (XOM) , Valero (VLO) , EOG (EOG) , and Schlumberger (SLB) for a few months now. They have mostly been disappointing with the exception of SLB and XOM. I still think there is more to come in the energy patch, but maybe not the next few days. I think they are under-owned and have been for a long time. So, it will take time for folks to consider warming up to them.
New Ideas
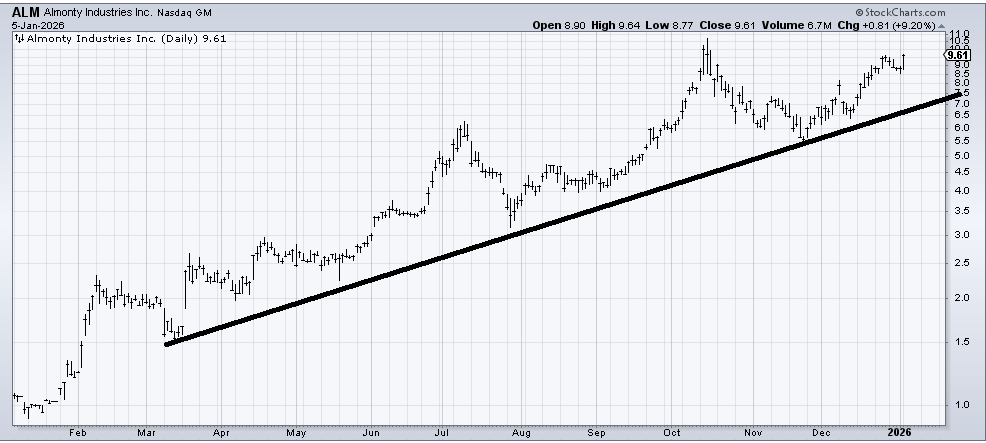
This first chart is one you should consider putting on your screen—after you say to yourself, ‘what the heck is Helene thinking?’. Keep in mind, last year when I highlighted PALL’s base, no one was thinking Palladium can have a run. Some folks might not have even known what it is used for (I am still murky on it!). But I saw a write-up on Tungsten recently that caught my eye. There is no ETF for it. There really are no charts that are US-based except for Almonty (ALM), but the chart is not really a base, although it’s a good chart.
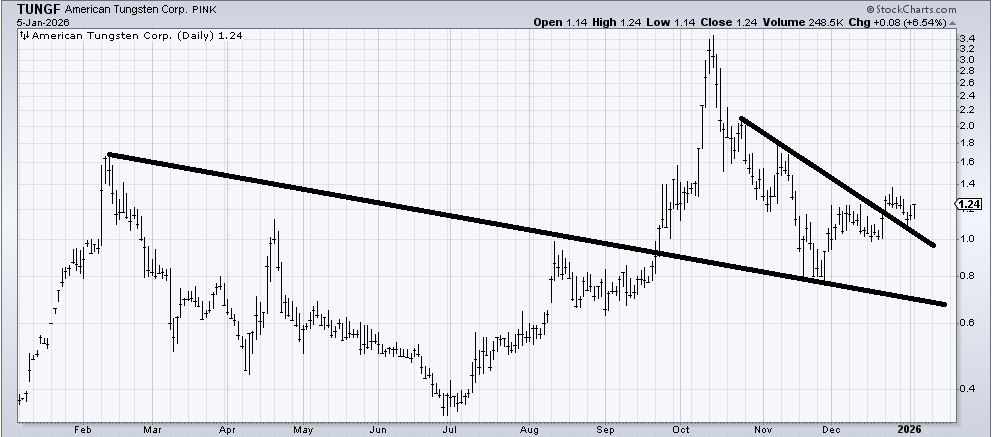
So I found American Tungsten (TUNGF), which trades very thinly and on the Pink Sheets, but gosh, what a base.
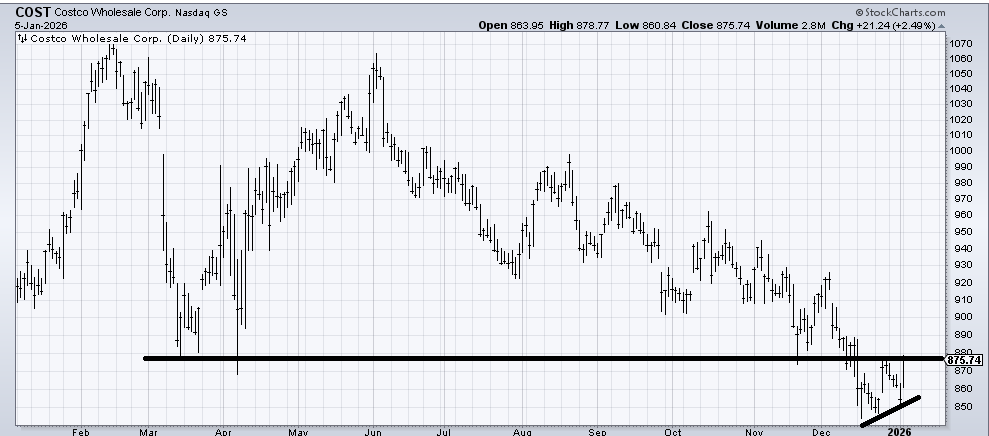
Next up is Costco (COST) , which I have had several inquiries on. I still think it is trying to desperately recapture that 875 area. It has tried twice and failed. I think it gets over it, but so far, it has not done so. If it trades under 840-ish, I would probably give up on it.
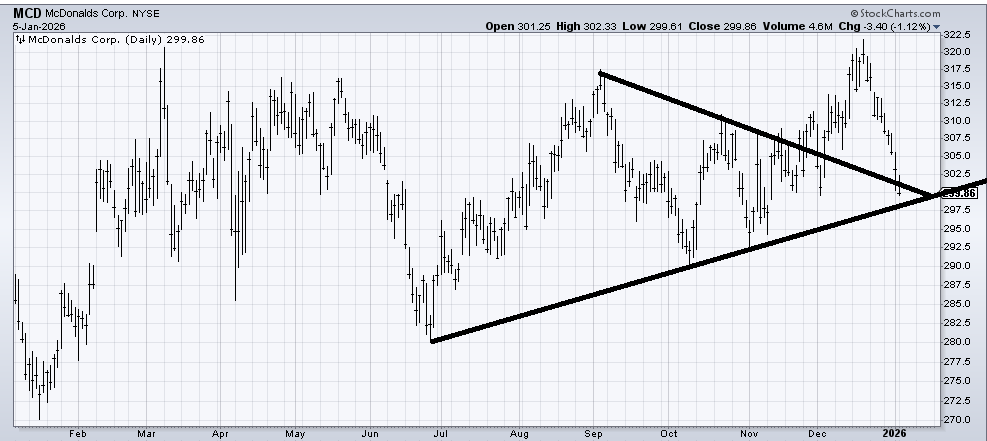
Then there is McDonald’s (MCD) , which I liked in early December. It had a nice run, and then it not only died, it collapsed. It has now been red for six straight days, which makes it oversold. I would be shocked if it doesn’t rally in the next few days from this area, but I have been dead wrong on this.
Today’s Indicator
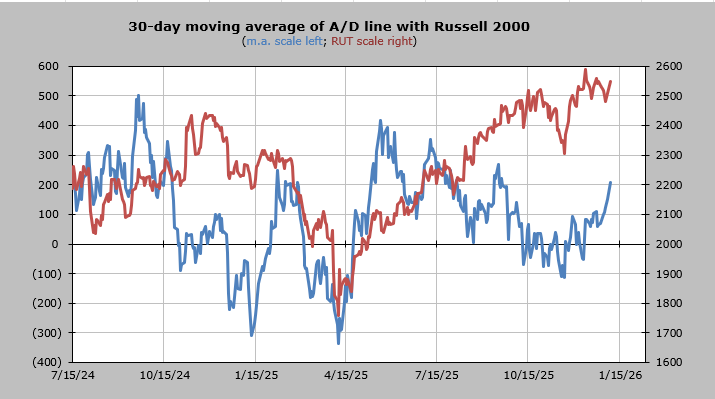
The 30-day moving average of the advance/decline line will be overbought by Wednesday.
Q&A/Reader’s Feedback
Helene welcomes your questions about Top Stocks and her charting strategy and techniques. Please send an email directly to Helene with your questions. However, please remember that TheStreet.com Top Stocks is not intended to provide personalized investment advice. Email Helene here.
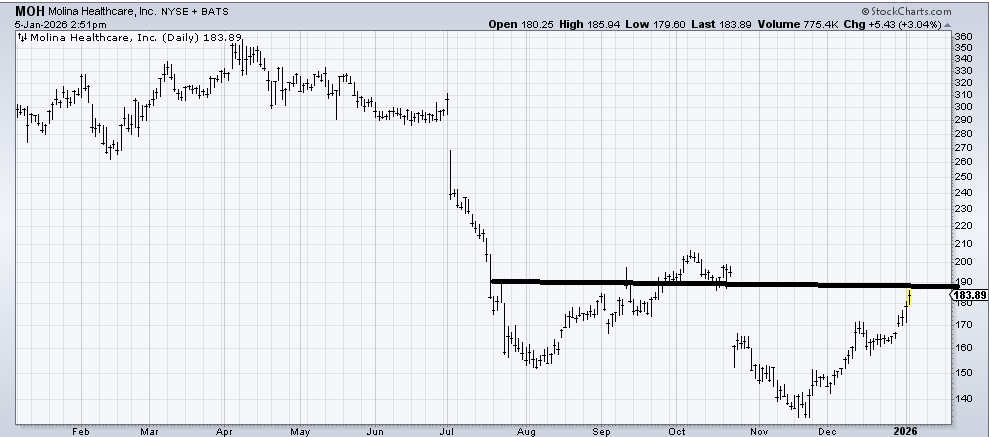
Molina Healthcare (MOH) should run into some short-term trouble in the 190-195 area. That is resistance, and a gap fill, and a measured target. But if it then pulls back toward 170-175, it would probably be buyable again.
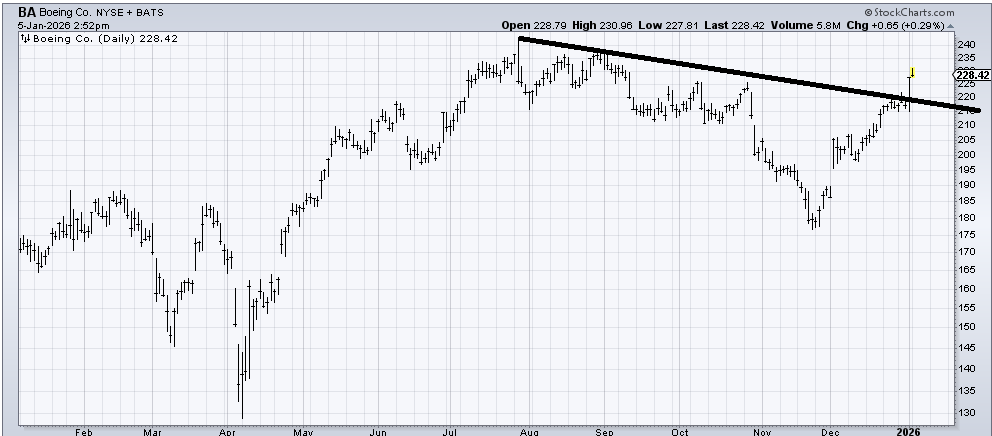
Boeing (BA) would be good if it can pull back to that 215 area and test the downtrend line it broke through last week.
EOG Resources (EOG) is a chart I liked months ago, and I have been dead wrong about it. If it breaks 102, I’d run for the hills.
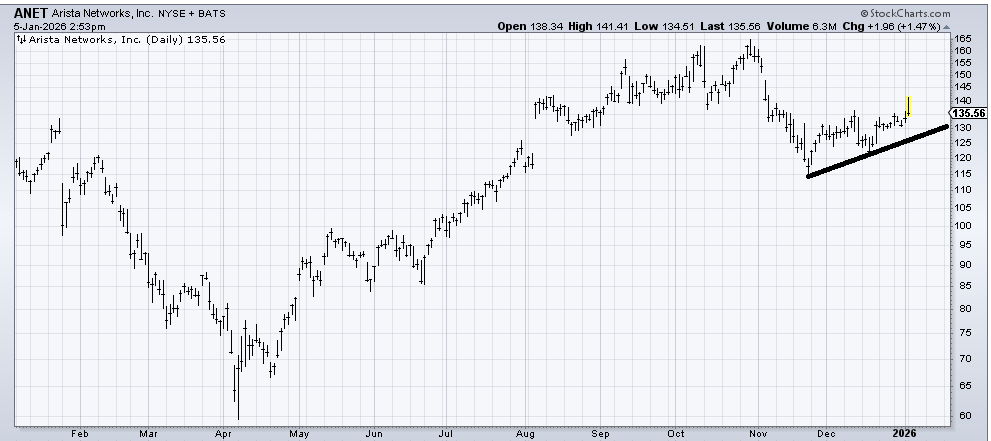
I don’t love the chart of Arista Networks (ANET) , but I think as long as it stays over 130, it has a shot at filling that gap up near 150.
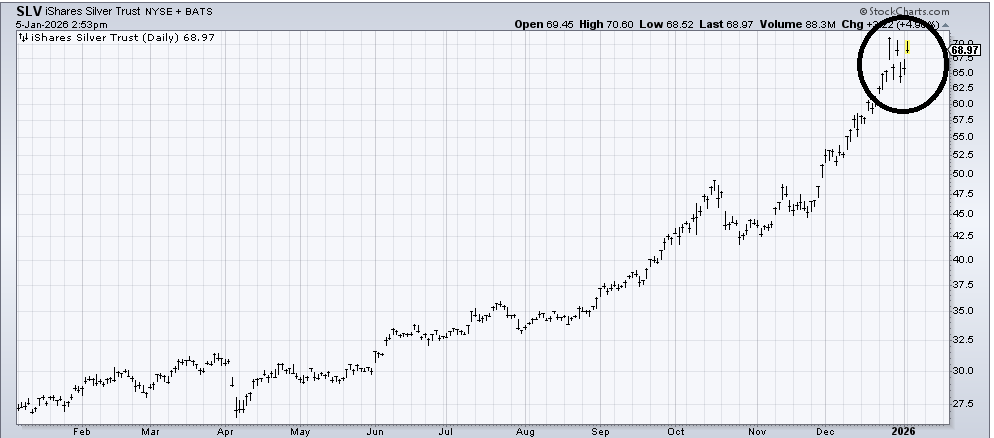
Before I left on vacation, I said I thought the metals were due for a pullback and that maybe my timing wouldn’t be great, but with the DSI on Silver at 89, it was enough for me. Since then, it has gapped down, gapped up, gapped down, and gapped up, rendering the chart of SLV the same price it was when I said that. I still feel that way. There will come a time when this sets up better. I just don’t see it now.
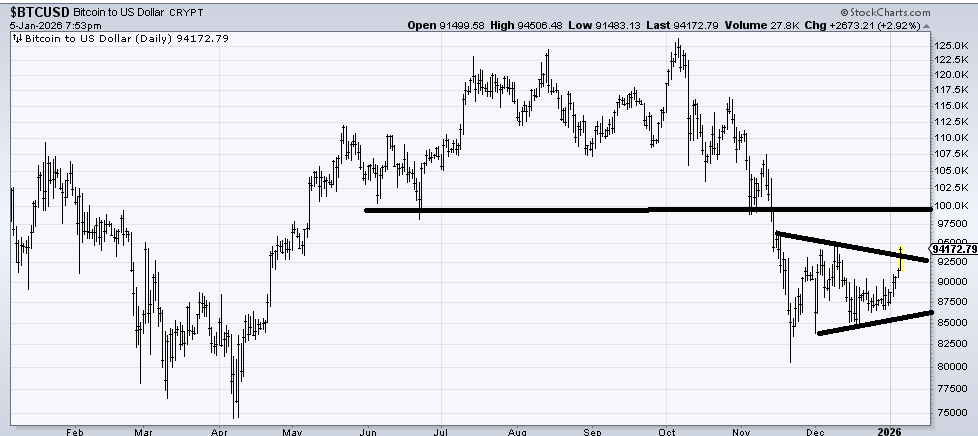
With the caveat that I am a Bitcoin skeptic, I have not changed my view on it. I said in late November it was a buy because the DSI had gotten to 13 and the chatter was extreme. BTC was 83,000 at the time. If it can get over 95,000, then the next stop is 100k.