Stock Options Signal Volatility, but Will We Just Get Choppiness Instead?
Elevated put/call ratio suggests traders aren’t buying calls—what that means for the next move.
You've reached your free article limit
You've read 0 of 1 free Pro articles.
The Market
So, we’ve essentially had three alternate days this week. Oh, I know the indexes don’t necessarily say it, but the stock charts do. (NVDA) down and everyone else rallies. NVDA up and everyone else levels off or goes down. In the end, so many charts look like this if they were up today:

Or if the stock was down today, it looks more like this:

That means there is an upward slant, but mostly there has been a whole lot of sideways action this week. I think we should get a bout of volatility, but my concern is that we’ll end up in a chopfest that will chew us to death.
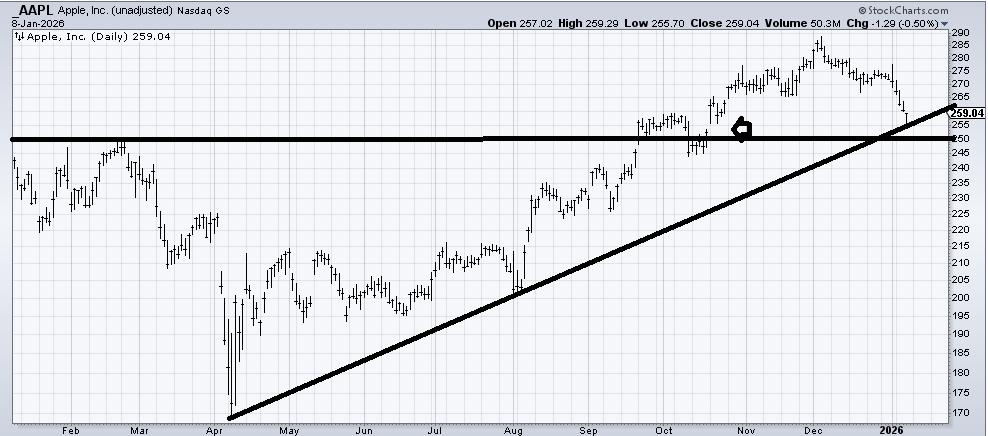
None of the indicators changed today. Heck, so few of the charts changed. But there is an awful lot of chatter about Apple (AAPL) and its seven straight down days. Typically, I’d be keen to bottom fish when a beloved stock is down so many days in a row, and it has bounced off this uptrend line dating back to the April low. It came awfully close to filling that little gap up from October, too (arrow on the chart).
I see two options: it fills that gap (call it 250-53-ish) and bounces. Or it bounces right from here. What I want to watch is the 265 area because I suspect whatever bounce we get ends up getting stopped there.
New Ideas
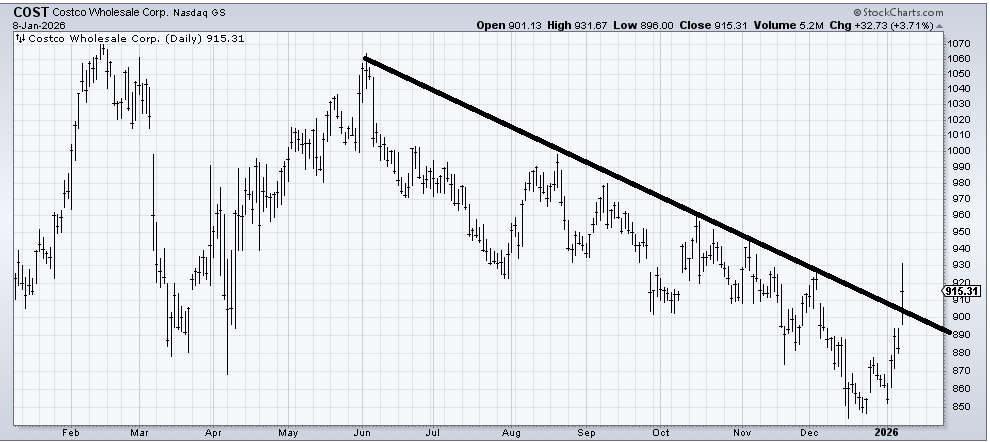
Let’s start with a follow-up on Costco (COST) , which finally crossed the line. As I said the other day, there is no breakout level because there is resistance all the way up. We just don’t want to see it trade back under that 890-ish area.
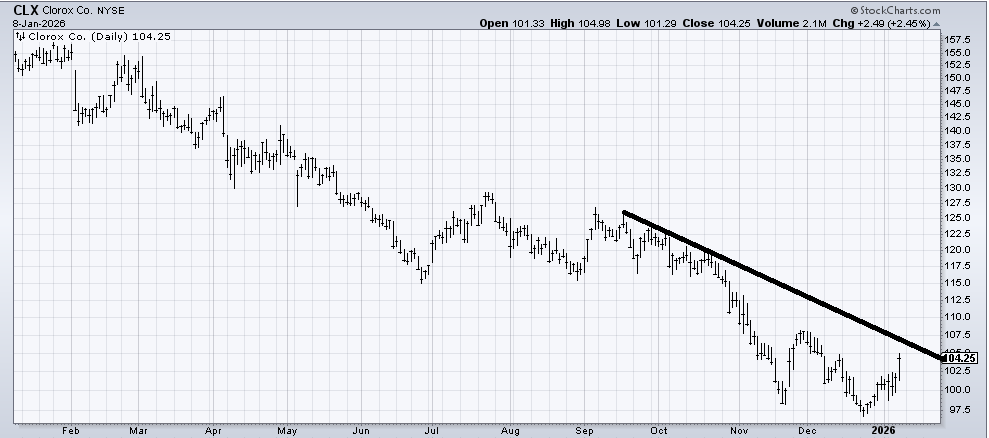
Then there is Clorox (CLX) , which we looked at just prior to my time off because it was yielding so much and was so oversold, I suggested it for a trade. That’s a big move we’ve had in the last few weeks, and the stock has decent resistance in this 107 area. I think selling some is a good idea, just to book some portion of the profit.
Today’s Indicator
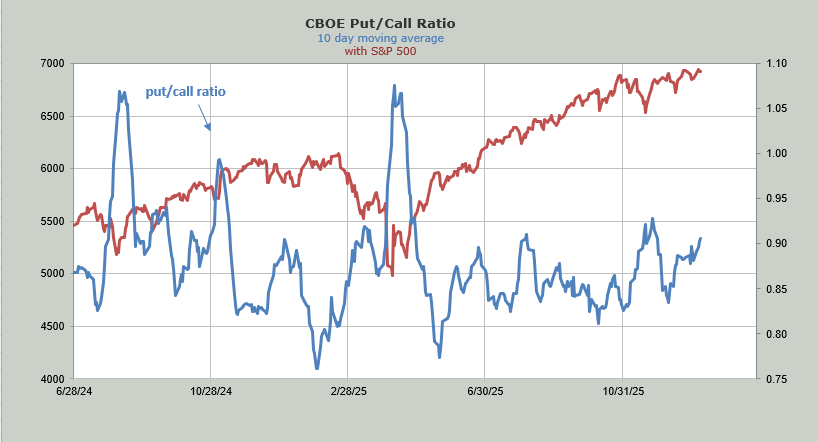
The 10-day moving average of the put/call ratio is worth focusing on. The market has rallied quite a bit from the last time the moving average was this high. In other words, the options folks are not buying calls as they usually would, and the moving average has not made a lower low since September. My experience is that this sort of action tends to precede volatility. Not always, but often.
Q&A/Reader’s Feedback
Helene welcomes your questions about Top Stocks and her charting strategy and techniques. Please send an email directly to Helene with your questions. However, please remember that TheStreet.com Top Stocks is not intended to provide personalized investment advice. Email Helene here.
Note that down below, you will see many tech stocks discussed. Few, if any, have made a lower low. The question in the coming days will be if any of them break.
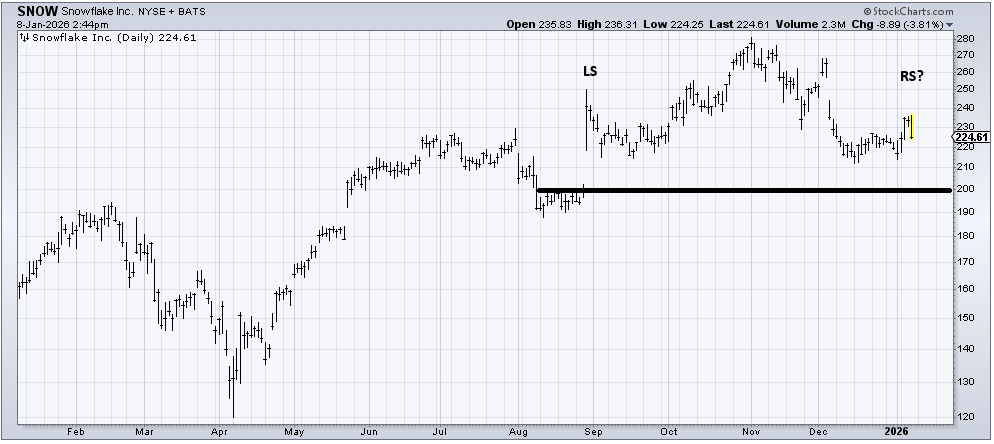
I really wanted Snowflake (SNOW) to fill that gap at 200 after it collapsed on earnings, but it refused to do it and instead rallied, and now looks like it has a head and shoulders top. If it breaks 210, it measures quite far down, like to 150—gulp. So, for now, let’s just say a break of 210 gives us a gap fill around 200. Keep in mind it has that island overhead that I highlighted back in early December, so if it can’t bounce, it’s bearish.
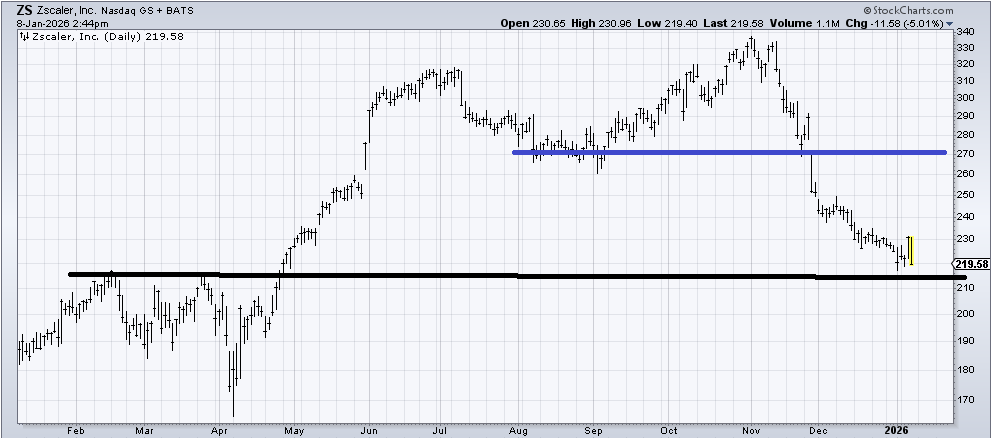
Zscaler (ZS) broke down from a double top (blue line), which measured to that 220 area it has been hovering in. I am inclined to think it’s early, but it should start to hold in this 210-220 area.
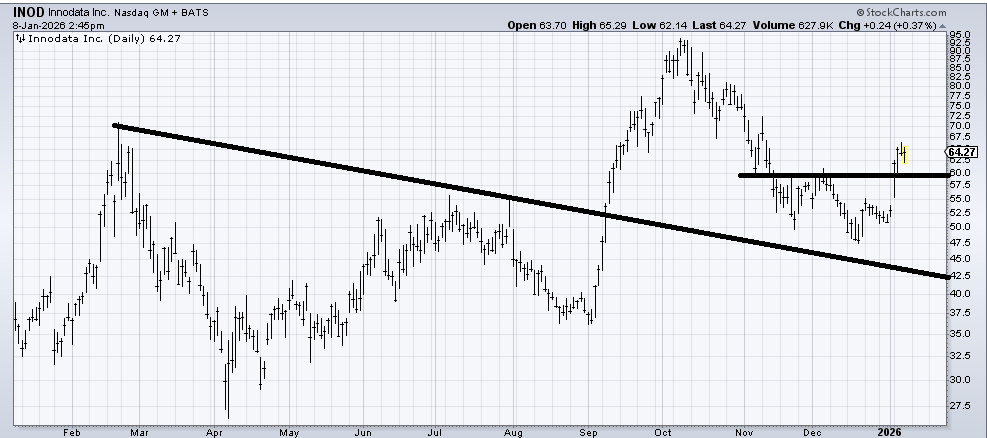
Innodata (INOD) has a measured target around 70. I’m just not sure if it pulls back to 60 first and then makes a run toward 70. If it does pull back to 60, I’d buy it with a tight stop.
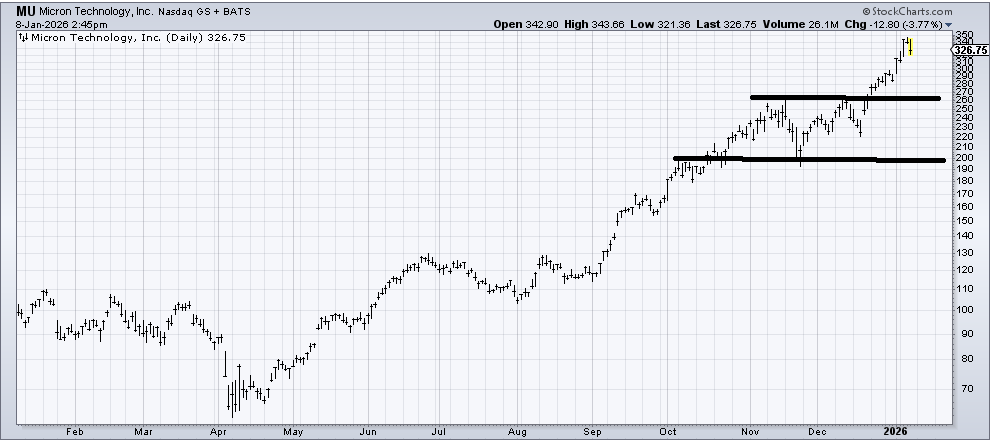
Micron (MU) is over-extended and has given back the entire rally it enjoyed on Tuesday. It has also met its measured target off that consolidation from the fourth quarter. The support is all the way back at 260, with some light support at 290. On a trading basis, I’d take some profits, but it hasn’t done anything wrong in the big picture.
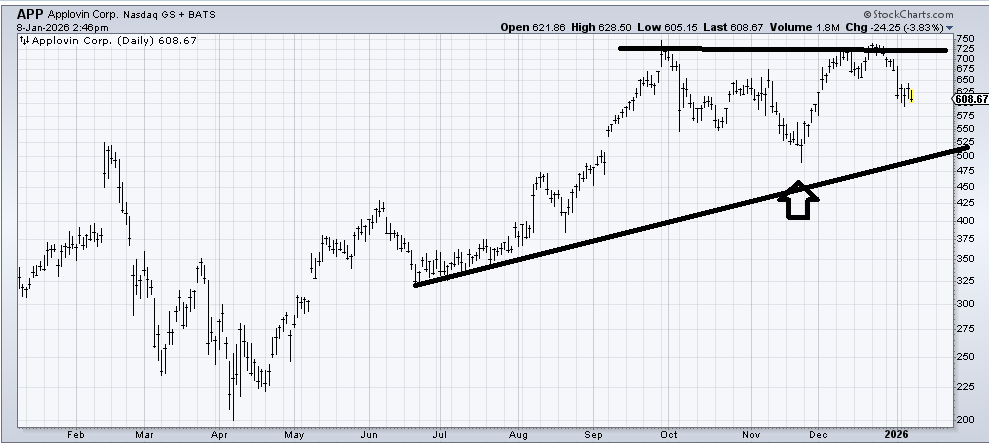
I would not be surprised if Applovin Corp (AAP) finds its way down to that line. It filled the gap (arrow), but I’d like to see a retest.
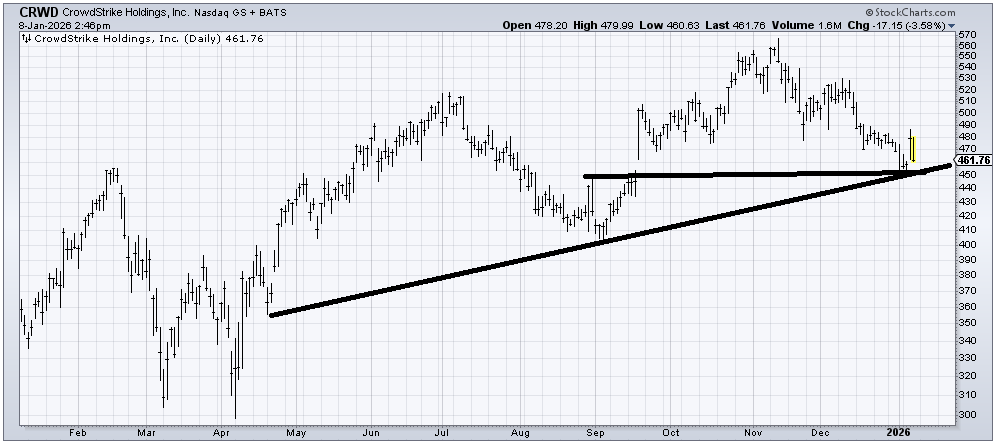
Crowdstrike (CRWD) has some decent support here. My confidence that it will hold over 450 isn’t high, though, so I’d use that as a stop area.
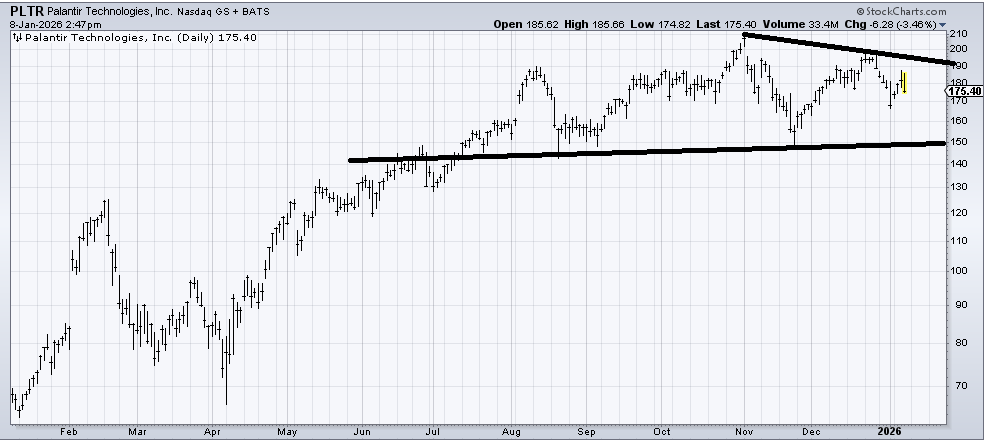
Palantir (PLTR) could use a push down to that 150 area. Obviously, if it gets up over that December high, I am wrong on that.
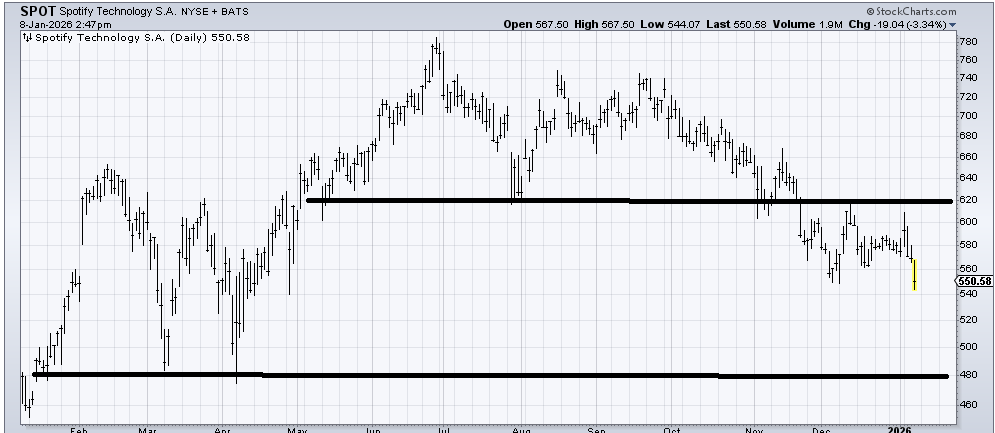
I believe the last time we looked at Spotify (SPOT) , I said I thought it could rally, but if it couldn’t get over 620, it would be bearish. That top measures down to the 490-510 area.
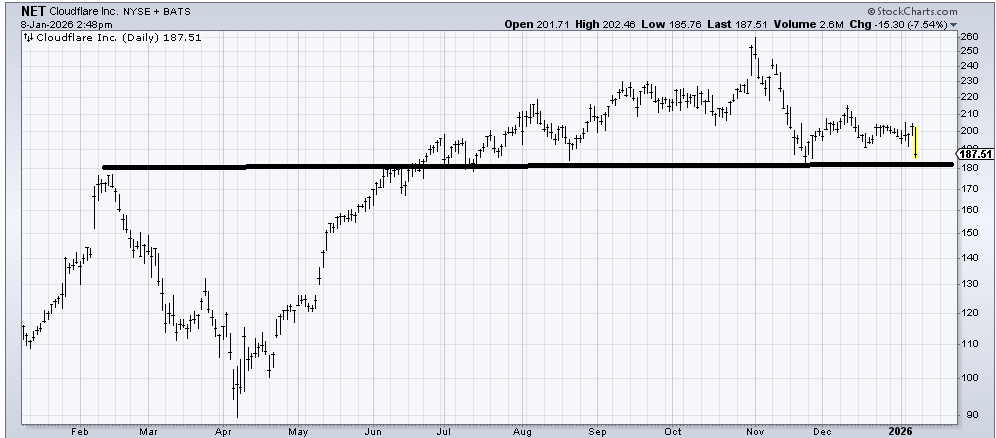
Cloudflare ( (NET) ) looks like a top, so it had better hold 180. If it breaks, the measured target is that gap fill in the 120-130 area.
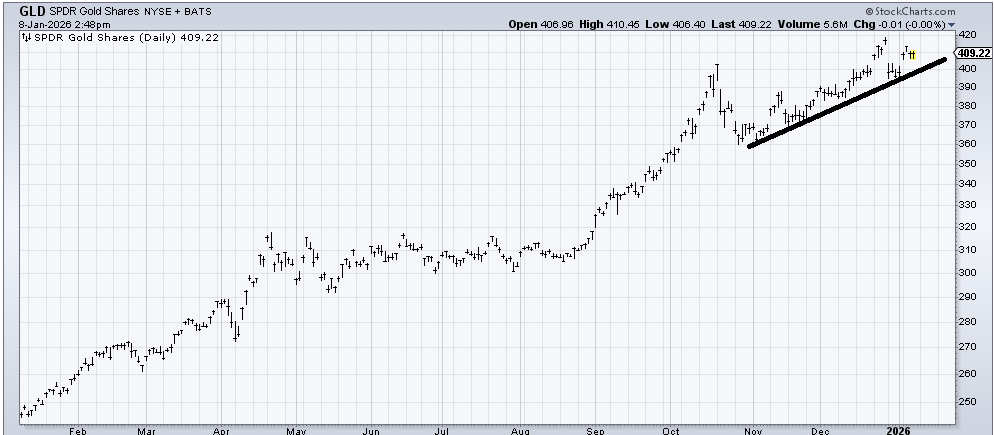
The chart of (GLD) , an ETF to be long gold, hasn’t done anything wrong. But I am not a fan of GLD here. I want to see a pattern set up, and I don’t like the sentiment having gotten giddy a few weeks ago, although that seems to have backed off.
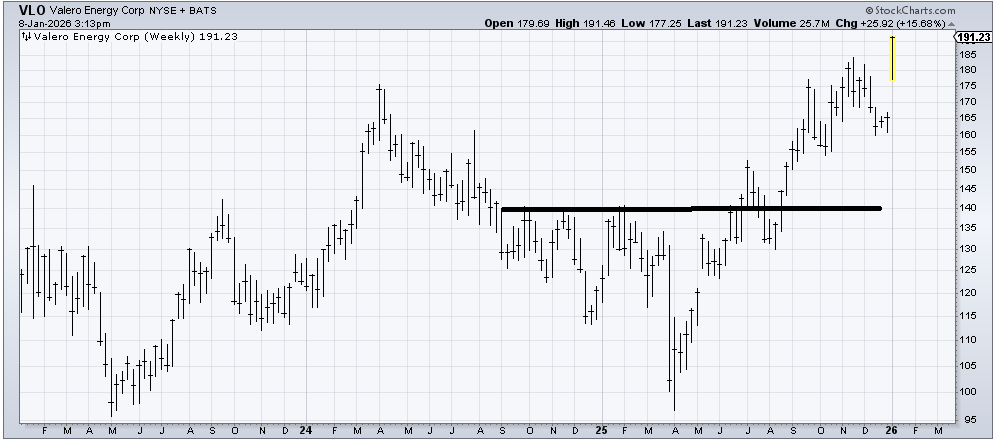
I recommended Valero (VLO) months ago, around 135, so the question is where does it measures to and is it buyable now? I am a terrible chaser, so I looked at the weekly chart. I have a measured target in the 190-200 area, so for now, I’m just a holder, not much interested in adding to it.
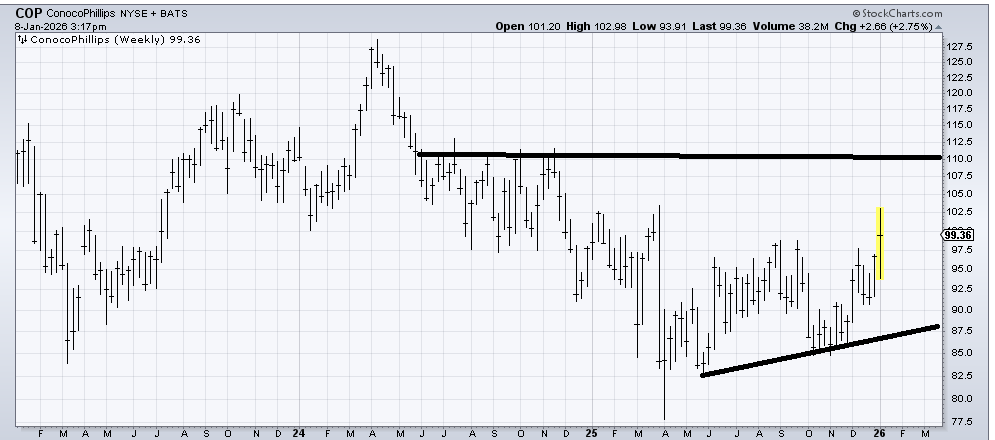
So I looked at the weekly chart of ConocoPhillips (COP) , and that seems to have more room to move. I just don’t have a good spot for a stop, but at least this one doesn’t have a feeling of chasing.