Statistics From Friday's Rally Offer Clues for What Might Come Next
Was it a short covering rally or something bigger?
You've reached your free article limit
You've read 0 of 1 free Pro articles.
The Market
The question of the day: was it a short covering rally (within a bearish move) or was it real buying? Maybe it was some of both. As Bob Prechter once said, all rallies begin with short covering.
Let’s look at some of the statistics. Breadth was good. It was superb considering the point move up, but good is good. 81% of the volume was on the upside. Is that great? Not really. Is it bad? Nope.
I think we got short-term oversold, especially in technology stocks (software mainly), and this is the result. Should we expect follow-through? My data says the early days of the week are a toss-up. But if we do in fact see some giveback early in the week (likely) then I think we would see another rally later in the week.
I didn’t see much in the way of sentiment change except that everyone seems to be telling us after the fact that they caught the rally because ‘it was so obvious’ how oversold we were. Of course, they didn’t bother to tell us that on Thursday afternoon! Statistically, I’m going back to the ISE Equity call/put ratio, which now has four straight readings under 2.0. So that tells me the call buying on Friday was not excessive at all. So much for all those folks who just knew a rally was coming!
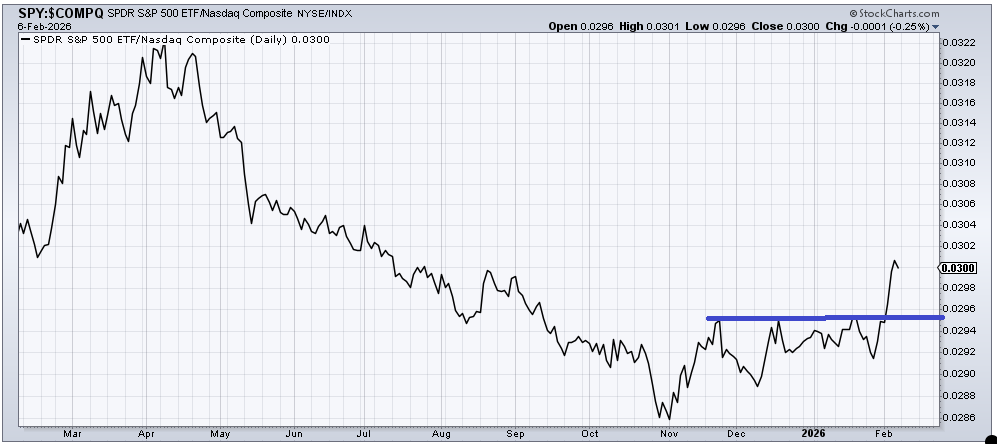
But on an intermediate-term basis, I keep going back to the ratio of the S&P to Nasdaq. It ticked down a bit on Friday (Nasdaq outperformed), but it would be unusual for this ratio to peter out right here without another push up in the coming weeks.
So, for now, let’s just focus on the short term and note that a pullback early in the week might get the bears back out but should then lead to another push upward in the latter part of the week.
Let me finish by saying something about software. I believe we will start to see differentiation in the group, much the way the Mag 7 started to differentiate last summer. That process takes time to sort out which ones will form bases and be good again and which ones will not. First, every stock is entitled to an oversold bounce.
New Ideas
As someone who likes to bottom-fish, it’s hard for me to get excited over the Transports, which were clearly the best group of the week (reminder, I was a fan back in September, because I tend to be too early for my own good). It’s hard for me to love the drugs or staples up here, although I am still waiting for Pfizer to move! That mostly leaves bottom fishing in software, where there are no bases, just what looks like trades.
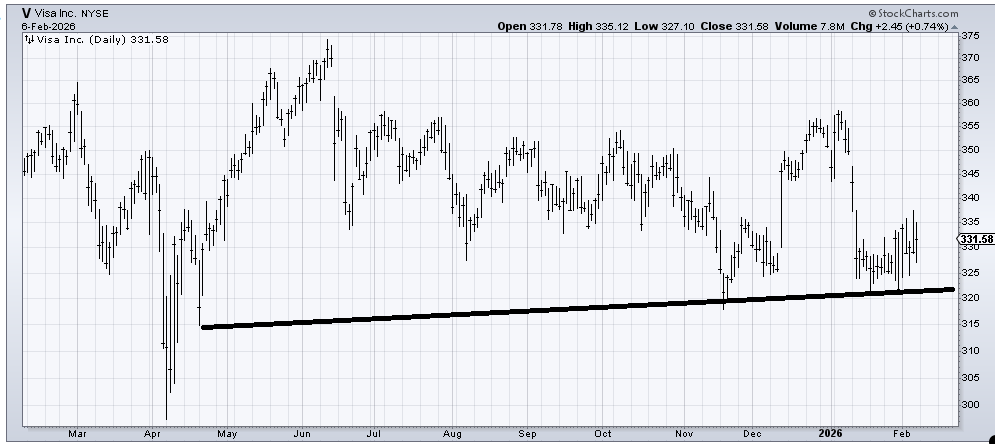
With that in mind, I want to revisit Visa (V) , which we looked at a few weeks ago, because it seemed to be holding that 325 area. It has hardly budged since then, but the stock holds this 320-ish area well, and if it can get going, that 345-350 area overhead would be a decent short-term target.
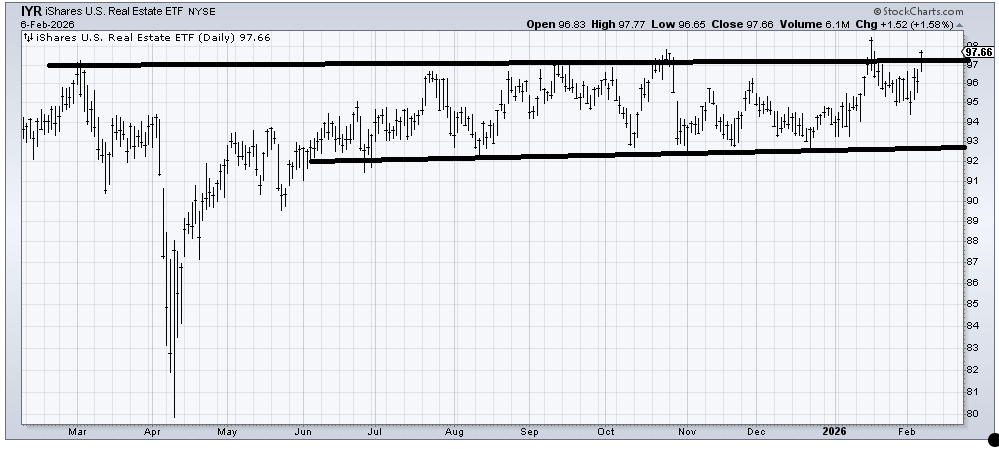
I would also remind you that (IYR) , the ETF to be long REITs, hasn’t done a thing in a year, and I still think it is one of the few groups that has a base. It’s maybe a buck or so higher than when I first recommended it.
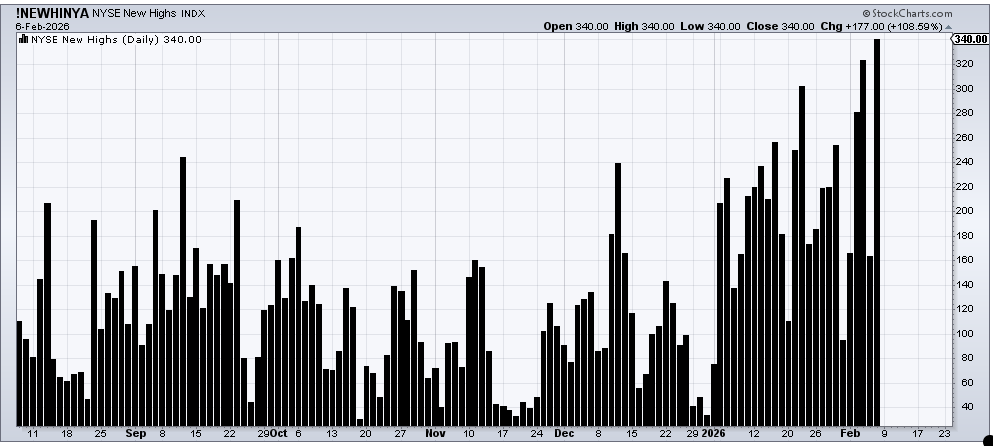
Today’s Indicator
The new highs on the NYSE keep expanding, a positive. Nasdaq is still about 200 issues off its peak reading.
Q&A/Reader’s Feedback
Helene welcomes your questions about Top Stocks and her charting strategy and techniques. Please send an email directly to Helene with your questions. However, please remember that TheStreet.com Top Stocks is not intended to provide personalized investment advice. Email Helene here.
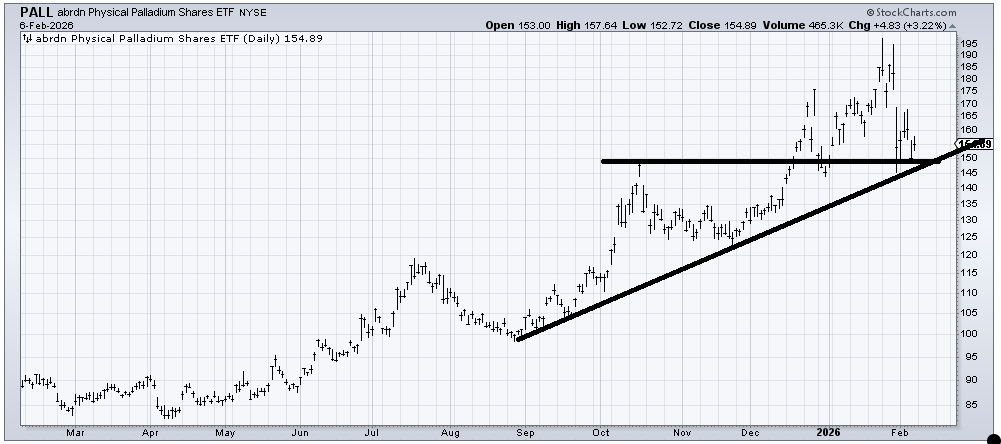
(PALL) , an ETF to be long Palladium, has been a good friend to us over the last year. Each spike has corrected gradually and given us an opportunity to trade it. The violent moves of late don’t offer that opportunity now. The same way it scooped under last summer and last fall is what I would like to see to get interested in it again. If it pushed under 145 with oomph, I think I would stay away.
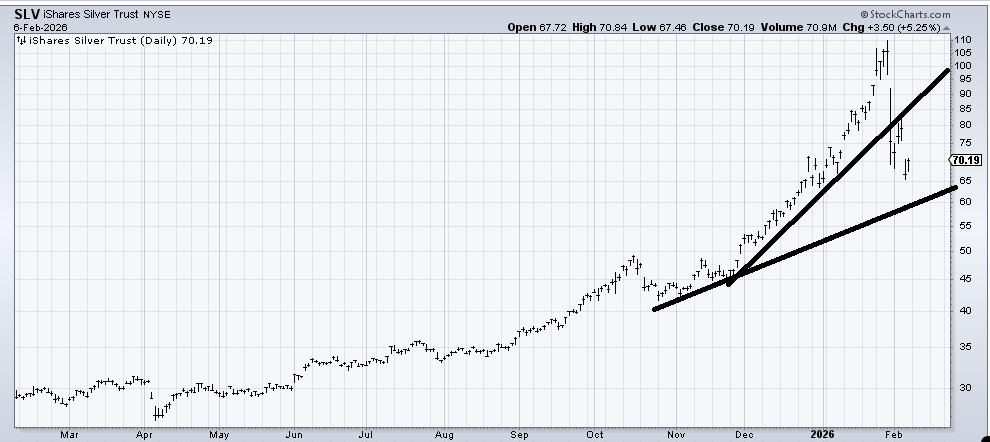
I think the bubble that was silver popped. Can it revive itself? Sure, but for me, it is going to have to set up a pattern I feel can do more than just rally to resistance. Right now, that support in the 60 area is where I would get concerned if it broke. Otherwise, as I said last week after the fever broke, it is more likely than not to do a lot of ups and downs, making you feel good one day and bad the next.
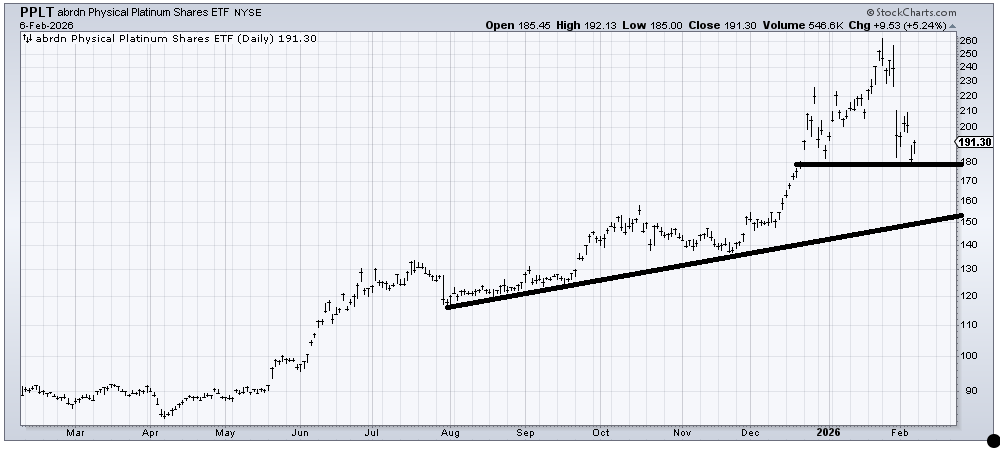
If (PPLT) , an ETF to be long Platinum, can stay over 180 and mill around for a few months, perhaps I could warm up to it, but right now it looks like a head and shoulders top, so if it breaks 180, then I think 150 is the next support.
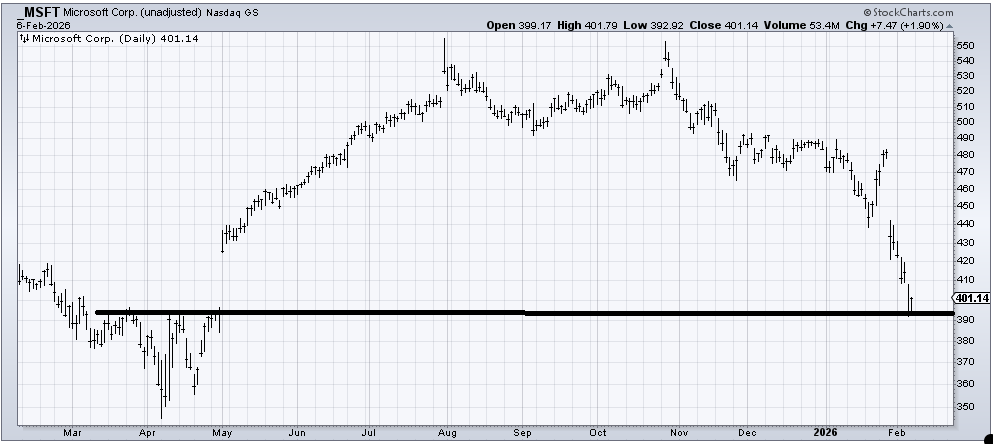
Microsoft (MSFT) finally filled the gap that was left from last spring. It is oversold enough to bounce—it really ought to. It’s also difficult to tell where true resistance lies, as there is light resistance at 410, some more at 420, and then much more serious at 440. For now, I would buy for a trade, especially if it dips early this week and can’t break 390-ish.
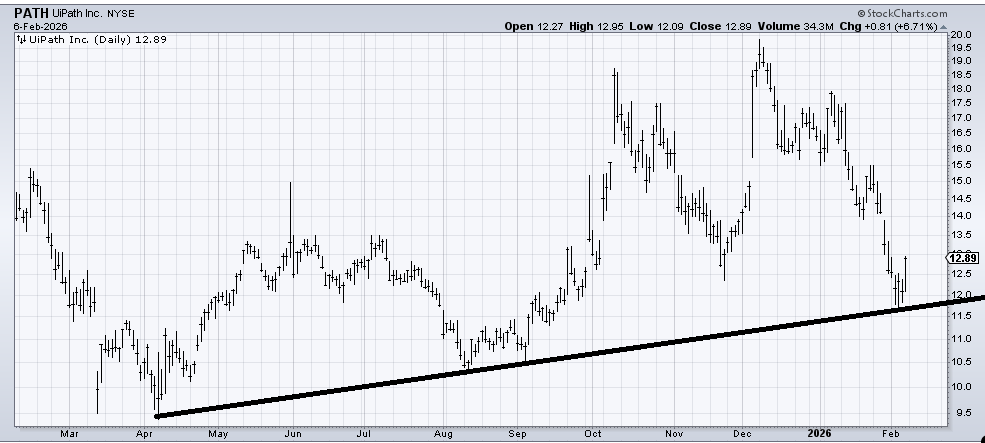
UPath (PATH) is the perfect example of a chart that came down a lot, held support, and yet has so much resistance all the way back up. But you know your risk/reward here (not bad) as a push under that 11.50 area, and you are dead wrong. First resistance is around 14
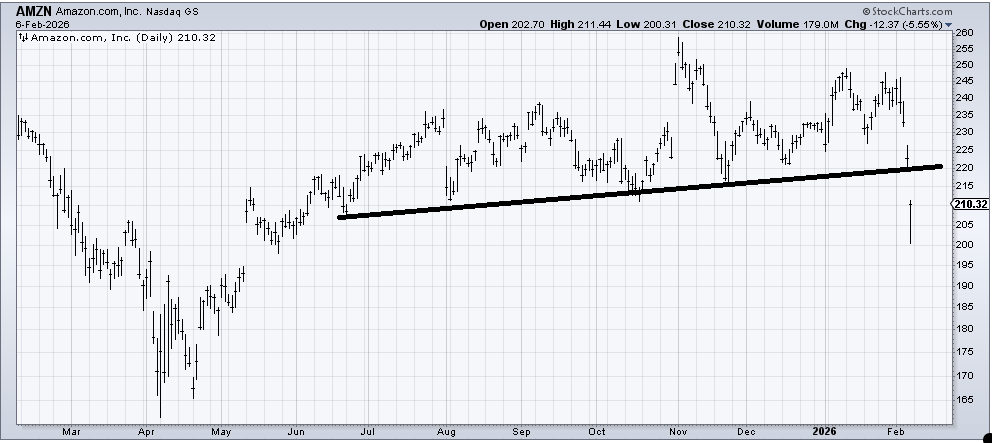
Amazon (AMZN) broke down from a big top. Now it gets the chance to recapture it. I would give it about a week to get back up over 220. A failure to do that and the longer-term target would be back in the 175-185 area (with plenty of stops along the way, like the gap fill around 195).
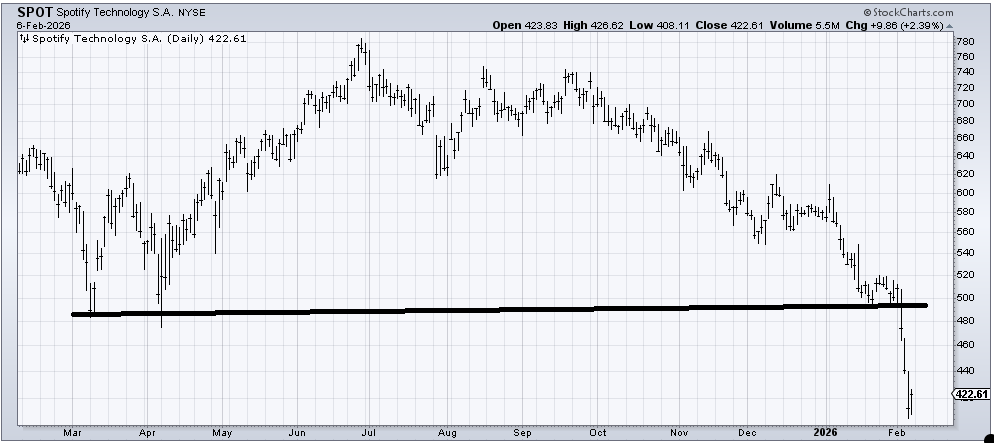
We have looked at Spotify (SPOT) several times recently, and I have not been a fan. I am still not a fan. The only good news is that it hit a measured target down here. If it can manage a rally back to 480-500, I’d sell that first rally.
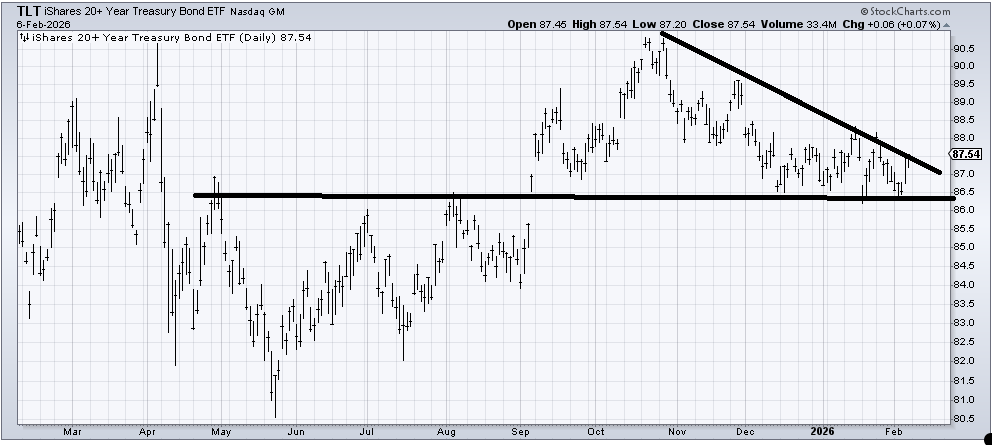
I am the idiot who keeps thinking bonds (TLT) are going to hold this upper 80s area, and TLT is likely to stay in a trading range for a long time (go back to the late 80s/90s, bonds stayed in a wide range for years). So TLT ought to cross that downtrend line, probably get everyone excited over lower rates, and then, when everyone is breathless, back down TLT should go.
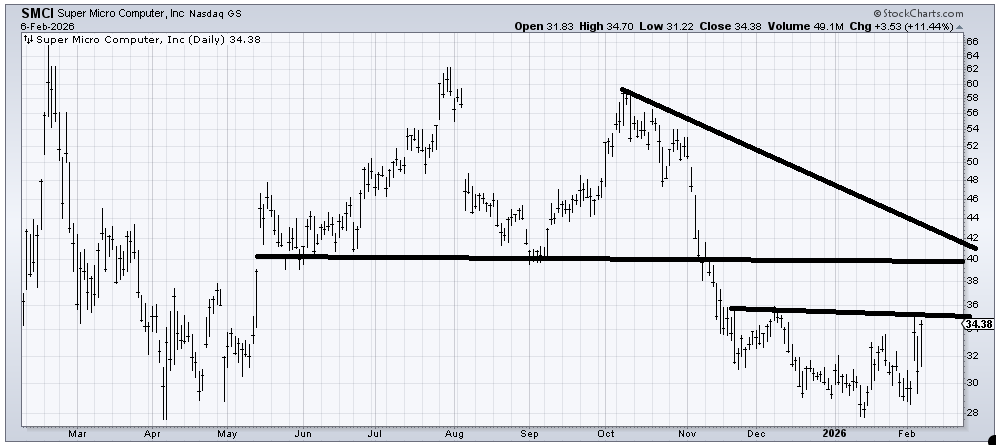
Super Micro Computer (SMCI) is the sort of chart I am drawn to. If it can cross this 35-36 area, it runs into resistance around 40-42, which is a decent trade.
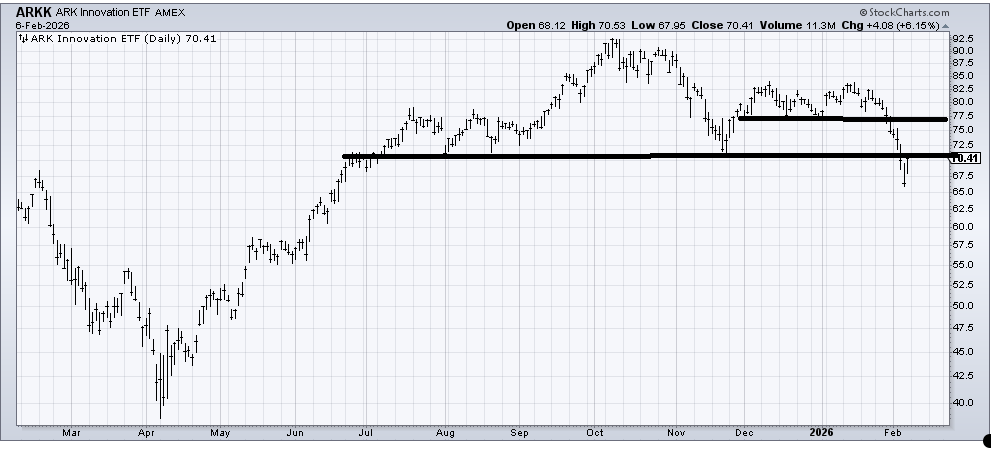
(ARKK) is oversold enough to bounce. Can it get through this 70-72 area? That’s a huge test for it. As is typical for me, I like to give a stock that breaks a chance to recapture the break (to see if it was a false break). If it can recapture it, then I think 77-78 is where it stalls out again.
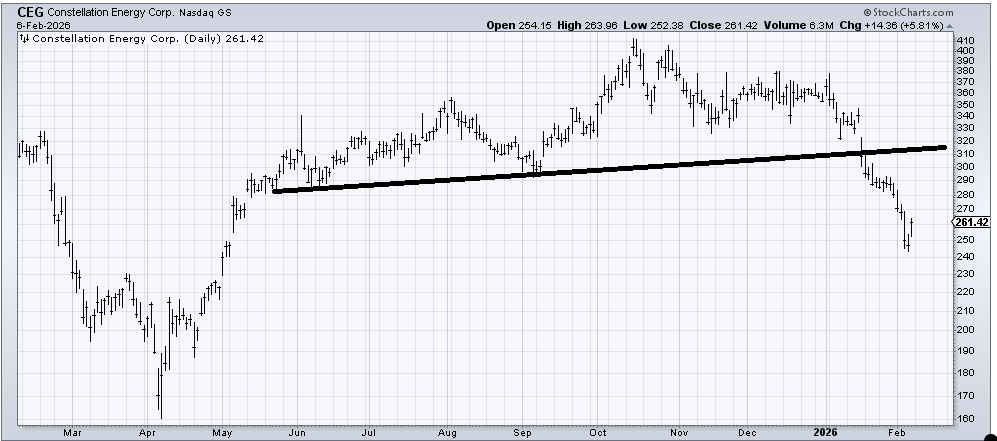
Constellation Energy (CEG) broke down from a big top and is now enjoying an oversold rally. I would not be surprised to see a rally to that 290-300 area. I’m not quite sure it can fill that gap at 330 on the first trip up, though.