Spotify Investors Get Good News After Steep Selloff
Spotify’s long-term chart shows a bullish trend.
You've reached your free article limit
You've read 0 of 1 free Pro articles.
Pop quiz: which of these investments has provided the better return since the start of 2023?
- Bitcoin
- Spotify
OK, you know that if bitcoin was the correct answer, I wouldn’t have asked. Spotify’s SPOT return of 770% since the start of 2023 beats bitcoin’s impressive gain of 713%.
295% in 18 Months
Since we first recommended Spotify to our readers in January 2024, the stock has gained 295%. Yet somehow, investors haven’t embraced the Stockholm, Sweden-based streaming service, instead focusing on names like Nvidia NVDA, Palantir PLTR and SoFi SOFI.
Through it all, Spotify has been a juggernaut, gaining 38% year-to-date, and nearly doubling over the past 12 months.
Those figures sounded even better before Spotify dove by over 11% in Tuesday’s trading. Is the Spotify rally now over, or is this pullback creating an opportunity for investors to finally get on board?
Charts Give Mixed Signals
Spotify, the world’s largest streaming service, has fallen by over $150 per share since hitting an all-time closing high of $775 just one month ago. Although the stock has fallen below its 50-day moving average (blue) it remains well above its 200-day moving average (red).
Both moving averages are streaming higher on Spotify’s daily chart, a bullish sign.
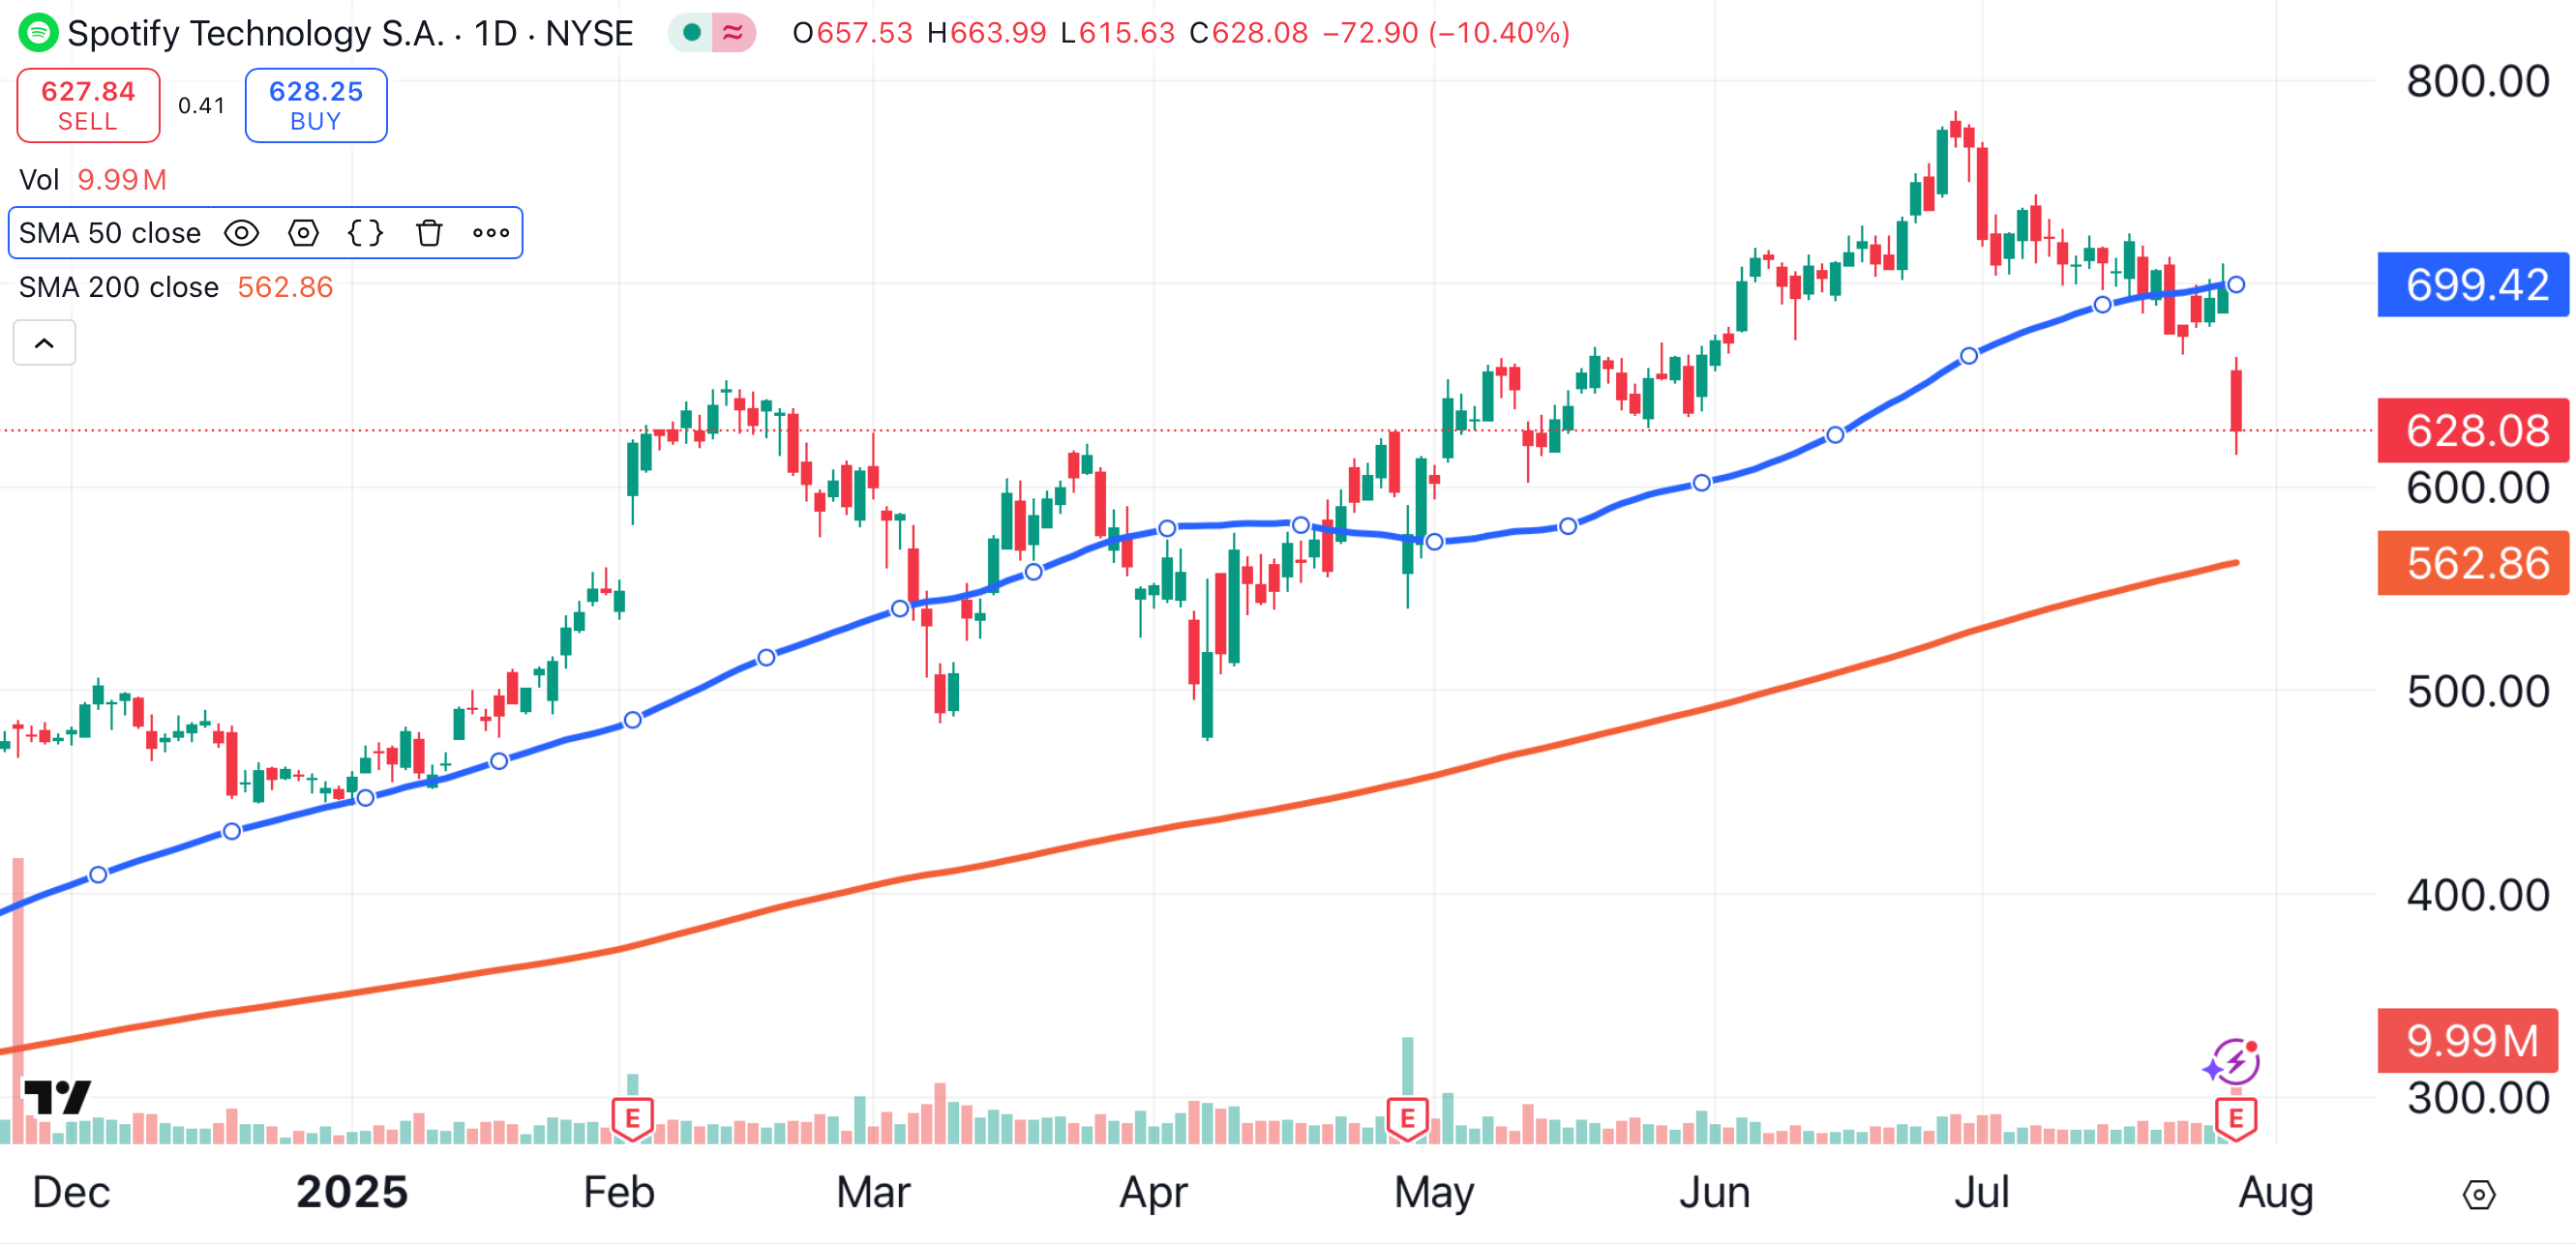
However, not all of the stock's technicals are positive. Spotify shares sold off on hefty volume, a sign of possible institutional selling. Spotify shares changed hands at a rapid pace, with Tuesday's turnover exceeding 500% of normal daily volume.
Unfortunately for shareholders, that could mean an even deeper pullback for Spotify shares over the coming days and weeks.
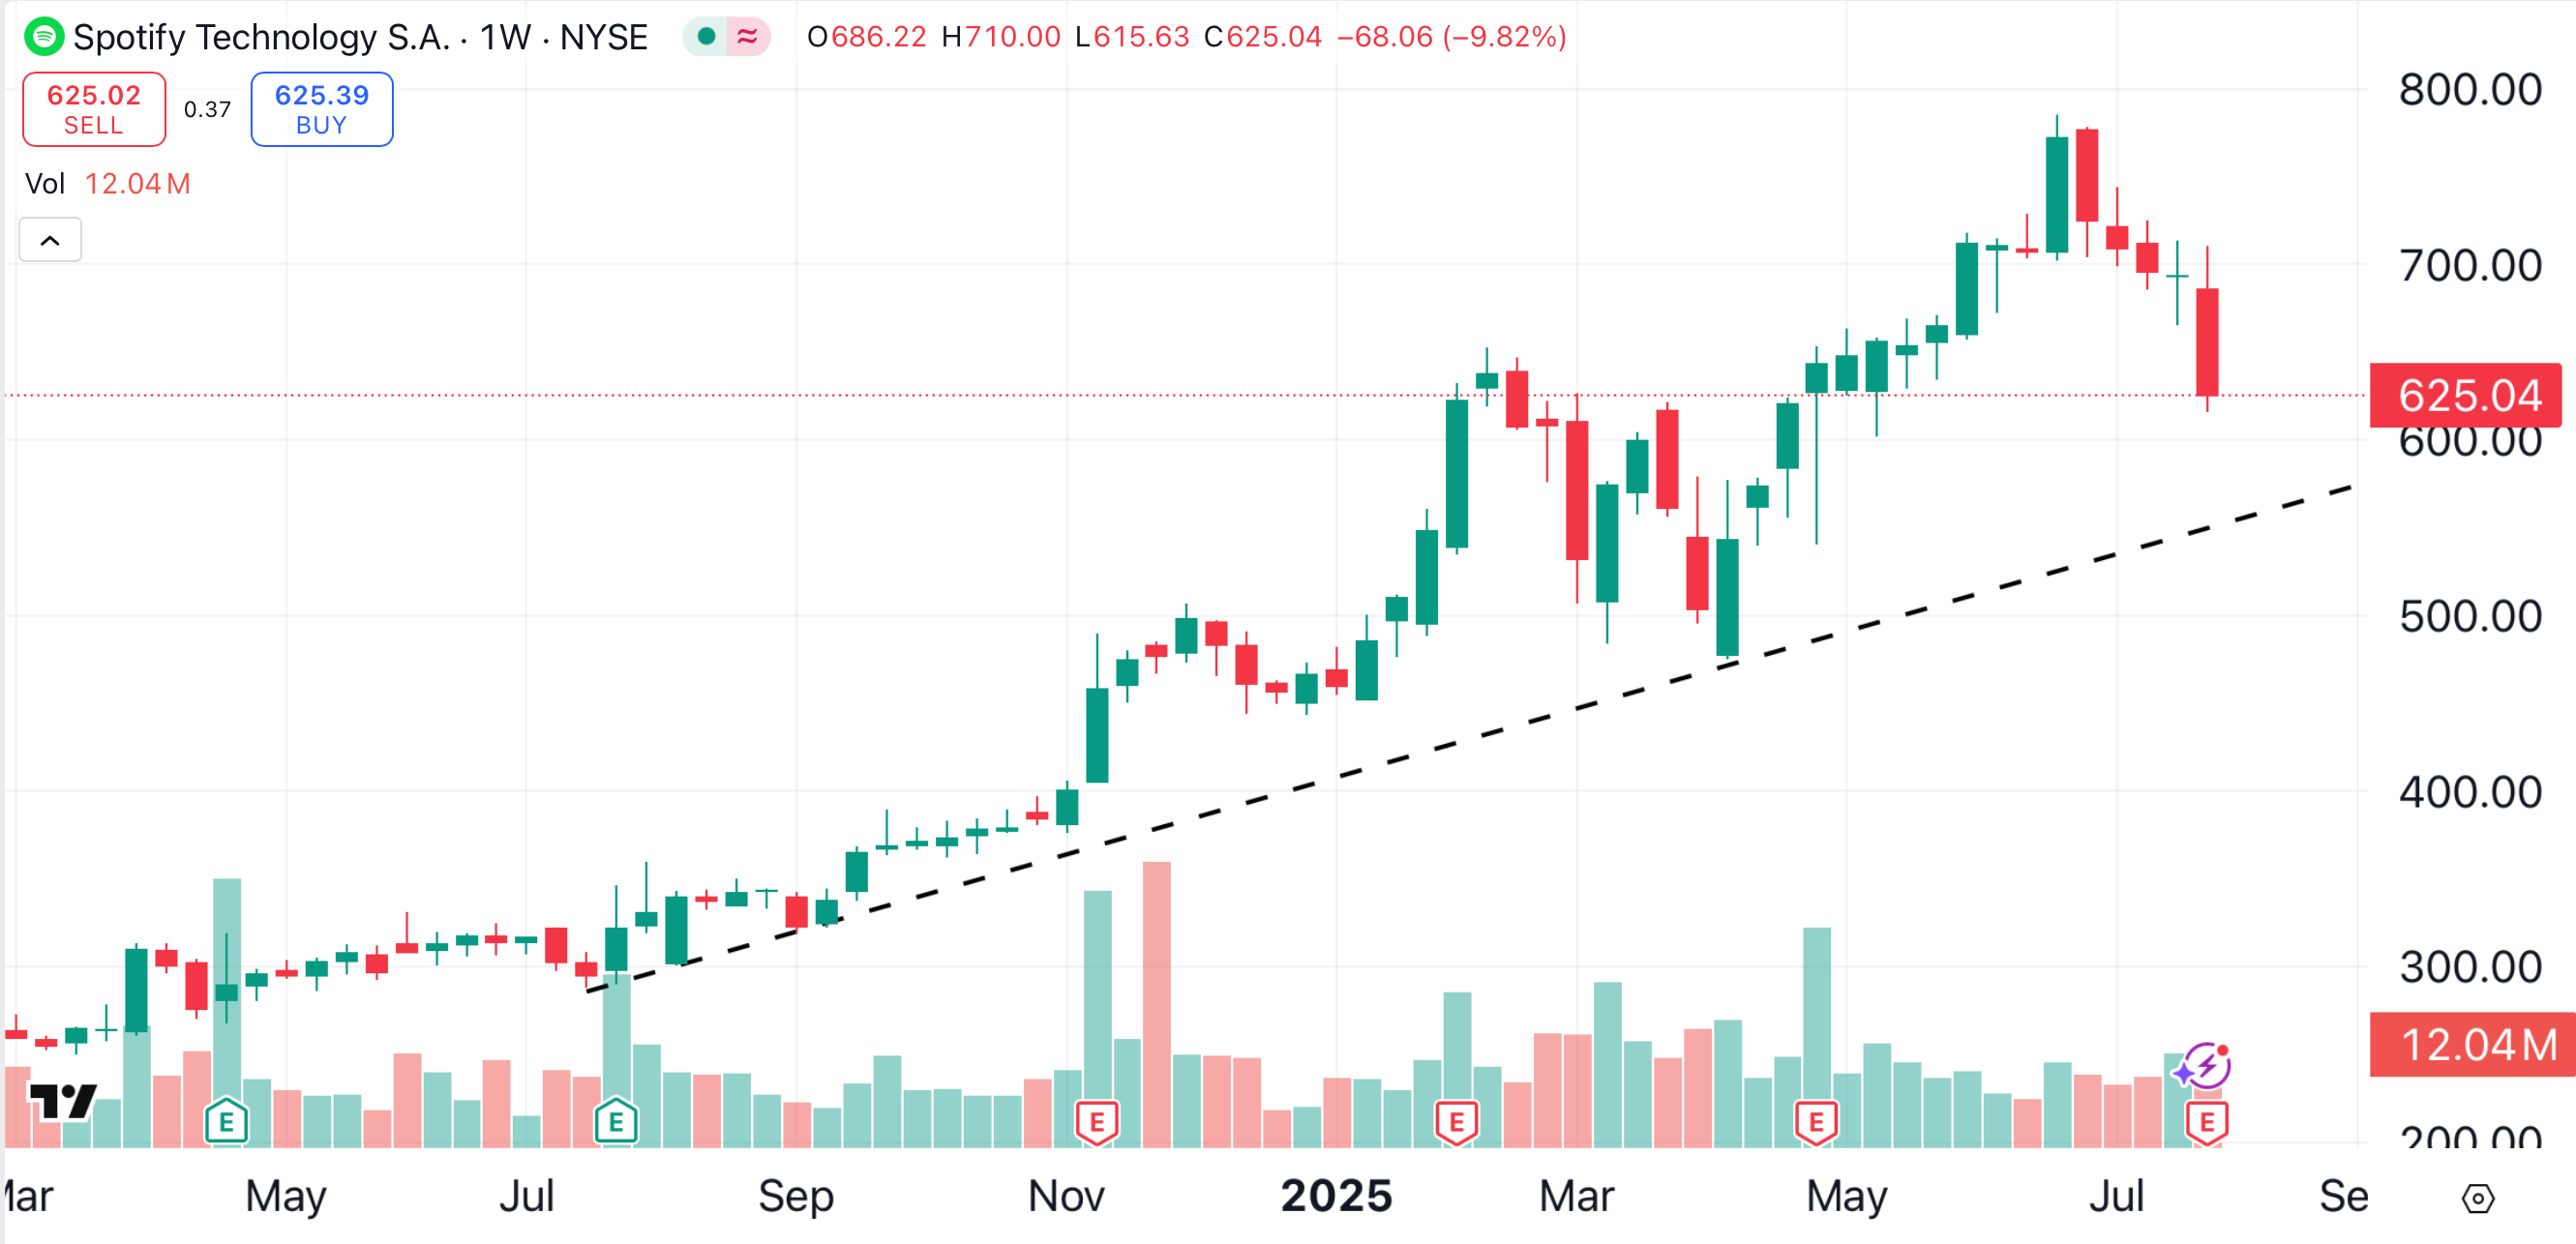
Spotify’s Sweet Spot
When will that selloff end? If we zoom out to Spotify’s weekly chart, we can see a bullish trendline that has been intact for over a year (black dotted line). If Spotify pulls back to that trendline, the stock should find support in the area between $575 and $600.
What’s The Buzz?
Spotify struck a sour note with investors when it missed earnings and revenue estimates for its second quarter on Tuesday morning. Plus, the company projected disappointing guidance for the current (third) quarter.
Spotify officials noted “outsized currency movements” as one reason behind the shortfall. As a European-based company, the falling U.S. dollar equates to falling profits.
While anything that puts a damper on earnings and revenue is unwelcome news, currency movement is out of the company’s control. There is nothing wrong with Spotify that a stronger dollar/weaker euro can’t cure.
That’s good news for investors. Tuesday’s miss had more to do with outside forces than a lack of execution on Spotify’s part.
Also, after a weak first half, the U.S. dollar is finally showing signs of a bottom.
Taking everything into account, there is no reason to sell the stock now. Investors who want to take advantage of Spotify's pullback can enter a small position at current levels, while keeping some powder dry for a deeper selloff.
At the time of publication, Ponsi was long SPOT and SOFI.
