Speculation Has Gotten Extreme
As I leave on my vacation, I share some charts for you to watch.
You've reached your free article limit
You've read 0 of 1 free Pro articles.
The Market
Note: I am taking a vacation. The next edition of Top Stocks will be next weekend, Sunday, June 22nd.
Nasdaq had near-record volume today. It traded just over 12 billion shares. And up volume was 75% of the total volume. Impressive, right? Especially considering Nasdaq was up 46 points, which isn’t very much.
Yet there were two penny stocks that traded 9 billion shares between them today. I admit, something seems awry, because it is hard for me to believe Nasdaq’s total volume was only 3+ billion shares. But one thing we know: penny stock volume is the majority of the up volume today, because we know that 9 billion shares traded in those two stocks.
Is this normal? No, it is not. Is it a sign of speculation? Yes, it is. Has it gotten extreme? Yes, it has.
I am never okay with a market that has so much action in penny stocks, but I am okay with it as long as the rest of the market is acting relatively normal. But that is not the case today. Nasdaq’s advance/decline line was negative. It is not normal to get a negative breadth day and also see 75% of the volume on the upside.
On the sentiment side of things, the AAII bulls moved up to 38.7% and the bears are now at 33.6%, so we have more bulls than bears in that survey now. The DSI for the S&P is at 77, and the Nasdaq is at 76. I will monitor these while on vacation, and if they get extreme, I will post something, so be sure to check, especially if the market keeps creeping upward.
Then there was the VIX, which has now been green for two straight days. Normally, that wouldn’t be a big deal (well, I am looking for more volatility so...), but it hasn’t had two consecutive green days since the first few days of May.
Finally, the buck. Everyone is talking about it today. I think this push down is going to give us a low of some sort. The DSI is 17. It won’t take that much more to get that to a ‘buy’ area.
New Ideas
While I am gone, there are a few charts I think you should watch. They have all stalled out, but none have broken. Some might say they are just resting. So, watch them because if they go from resting to breaking, that would signal a change. I have noted that the highs are not expanding, but neither are the new lows, but if the lows begin to expand, that would be a change.
We looked at GE and NFLX the other day, so I won’t repeat them.
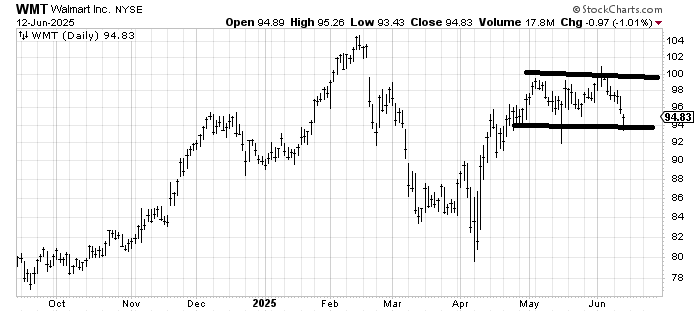
We looked at Walmart WMT a few weeks ago, and I said I thought it was likely to trade 95-100, and so far it has. It bounced off a low today, but if that low end breaks, that’s a change.
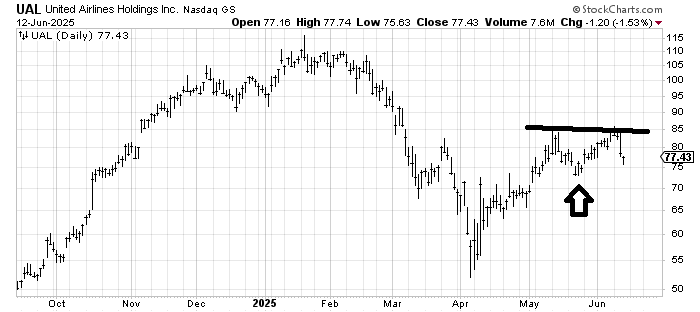
We looked at United Airlines UAL with a positive eye near that arrow. It had a nice run but has nearly given it all back. It couldn’t make a higher high, but does it break to a lower low?
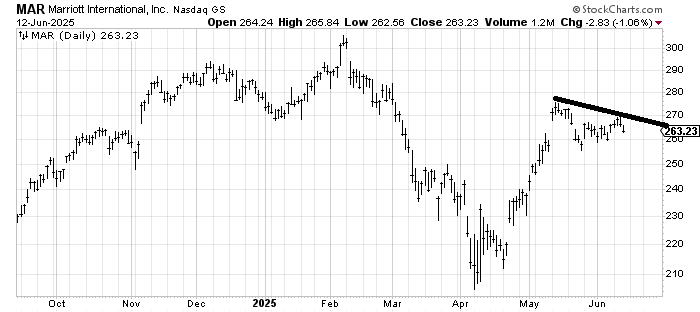
Marriott MAR could not make a higher high recently. Does it make a lower low?
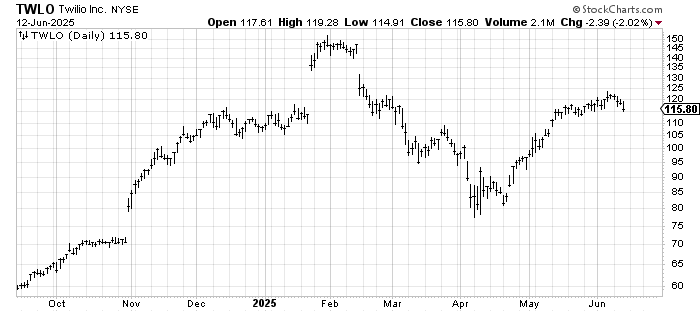
To get away from the consumer-facing names, we have Twilio TWLO, which has had a great run but hasn’t been a terribly hot name of late. Breaking this 113 area would signal a change.
Reminder: I still like the drugs!
Today’s Indicator
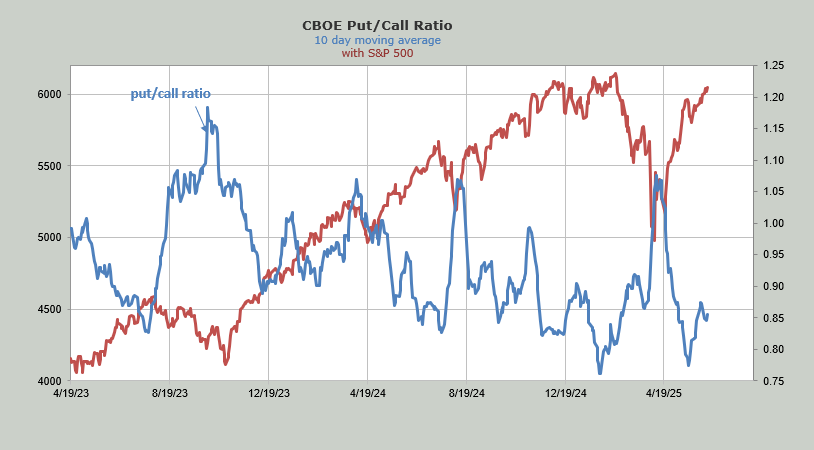
The ten-day moving average of the put/call ratio did not take a trip back down to the lows it was at a few weeks ago.
Q&A/Reader’s Feedback
Helene welcomes your questions about Top Stocks and her charting strategy and techniques. Please send an email directly to Helene with your questions. However, please remember that TheStreet.com Top Stocks is not intended to provide personalized investment advice. Email Helene here.
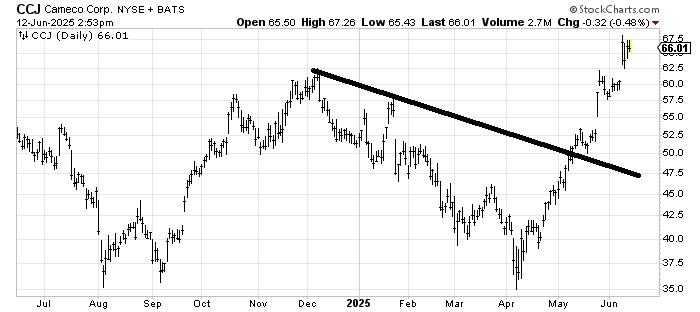
I was asked what the measured target for Cameco CCJ is. It measures to 70-75. There is another possible longer-term target at 90-ish.
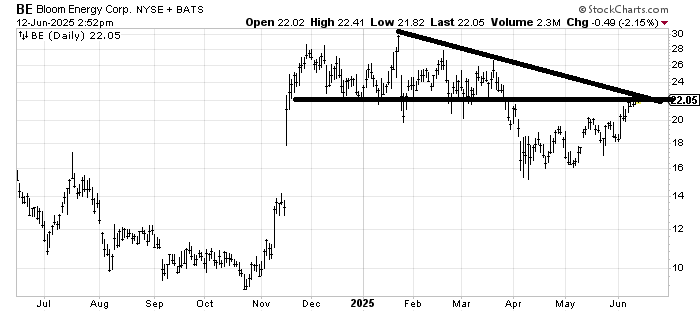
Bloom Energy BE still has resistance starting at 22 and all the way up. If it can cross that downtrend line, then at least we know it has eaten through some of the resistance.
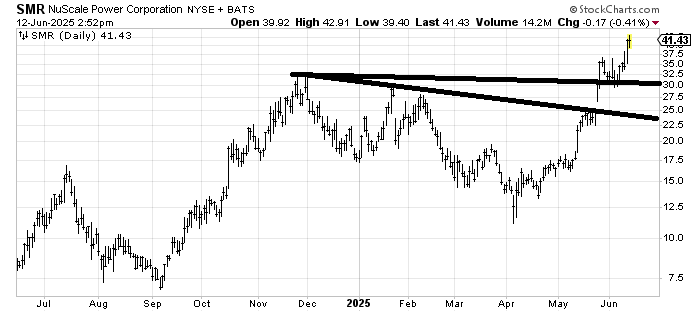
NuScale Power SMR has a measured target in this low 40 area. There is another target near 45.
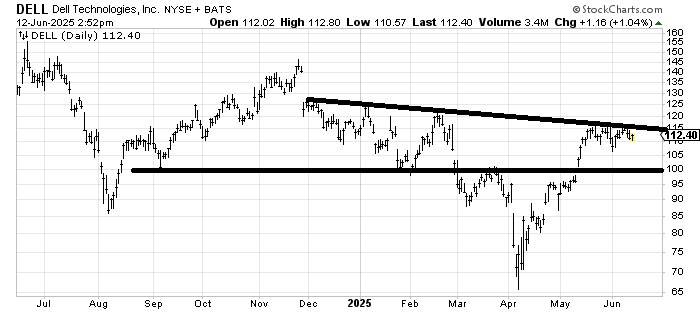
Dell Technologies DELL has really stalled out. If it can go sideways a bit longer, it’s got a chance to cross that line overhead around 115-117. Under 105 and there’s a problem.
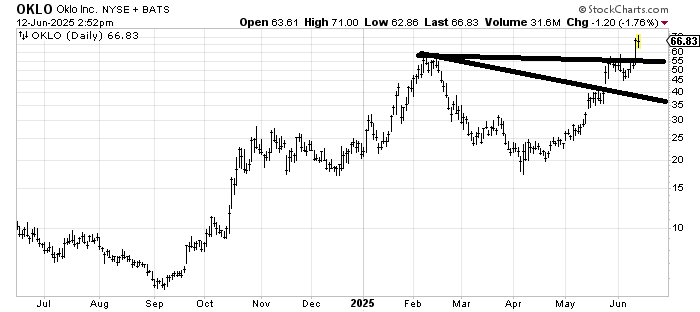
Oklo OKLOF has a measured target in the 70-75 area. There’s a possible longer-term target near 90.
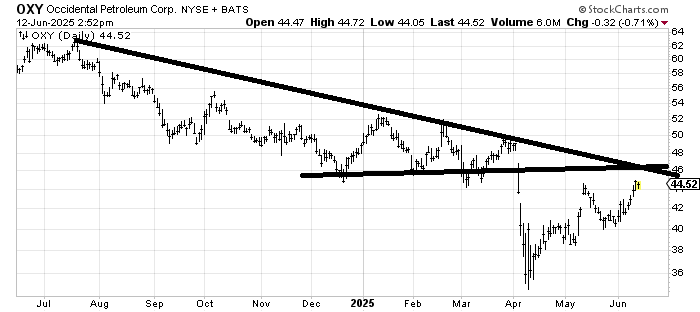
I would put Occidental Petroleum OXY in the same category as most of the energy stocks we’ve looked at: enjoying a rally to resistance. In this case, it is 46-48. Unless it can gap up over 48, that is probably where it stalls out.
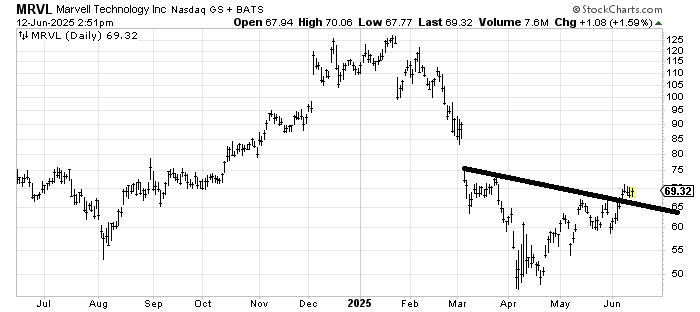
Marvel MRVL has been flagging for the last several days, so as long as it stays over 65-ish it ought to set its sights on filling that gap near 85.