Some Minor Changes to the Indicators
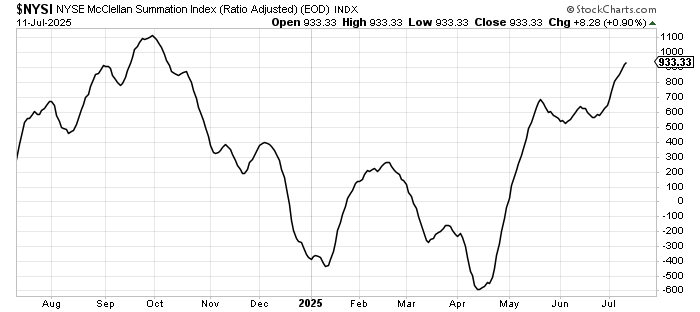
Let's dig in to the McClellan Summation Index to see what's changed.
You've reached your free article limit
You've read 0 of 1 free Pro articles.
The Market
But did anything change? Actually, there are some changes, they are only minor thus far.
I noted on Thursday evening that we had several stocks to watch for signs of breaking levels. There was not much breaking on Friday, but software stocks did remain weak. And along with them breadth was not great. Remember, many of my indicators are based on breadth, so if breadth turns sour, so will the indicators.
We entered Friday with the McClellan Summation Index heading upward and needing a net differential of -1700 advancers minus decliners on the NYSE to halt the rise. I consider that a decent cushion, meaning it will take more than one day to change the direction, maybe even two or three.
We now enter Monday with that number at -200. That’s a big shift. So the indicator is still rising, but the cushion went from decent to very little. And it did so while we are still overbought and sentiment is still relatively complacent.
Last week, I noted that the DSI for the S&P had gotten to 87, which was ‘enough’ for me (over 90 should be enough for everyone!). I also noted that even last year, in mid-July, when we had tagged 90 on Nasdaq it still took a week or so before the market cared. We’ll see if it cares this coming week, but the ingredients are still in place for a pullback.
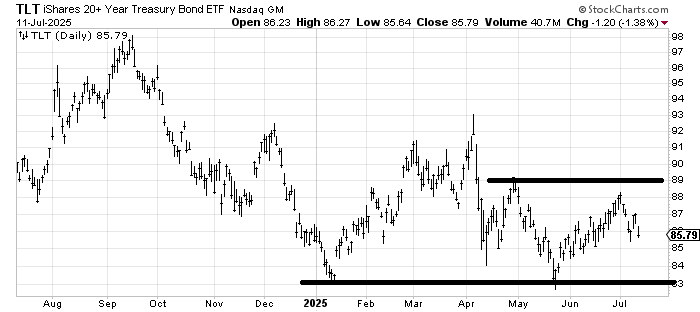
One other thing that changed is bonds. For the longest time, I have been of the mind that while rates may not be going down, they are not going up in a big way either. I still see the potential for a head and shoulders bottom in TLT (or a wide trading range), but whereas stocks haven’t cared much about bonds for a few months, I think it might start caring.
I thought TLT ought to get to 89 on that recent run, and it only got to 88, which means that’s a lower high. So I have put bonds on my list for a potential change. We’ve got the CPI out this week, so I want you too to pay attention to interest rates.
Finally, I have made a point of saying I don’t think we’ll get a similar reaction to tariffs now as we did in March/April, but that doesn’t mean I think tariffs don’t matter. They are a financial consideration and, like all things financial, they do have an effect on stocks (as opposed to politics, which I think do not have more than a temporary effect on stocks). So when I scoff that the market doesn’t care about tariffs anymore, I mean it doesn’t care about them the way it did in the spring, not that it won’t care at all.
New Ideas
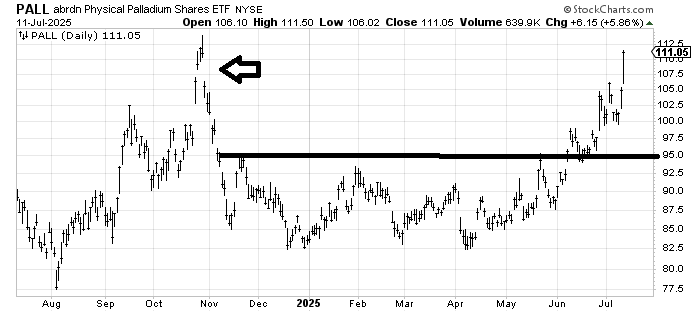
The chart of PALL, abrdn Physical Palladium Shares ETF, that I recommended a few months ago, finally got up to that gap fill and my target area. What’s more? CNBC finally noticed it! I’d be in favor of taking a little something off the table.
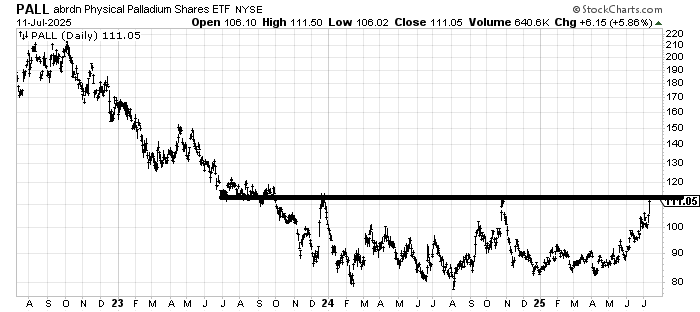
However, I do want to point out that the longer-term, weekly chart is still one giant base, so I still like the chart; it’s just from a trading standpoint, this has gotten to resistance.
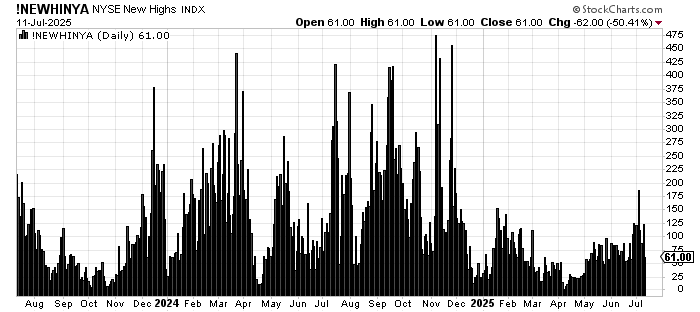
Today’s Indicator
The number of stocks making new highs still lags quite a bit. Look at a chart of the last two years, and you can see how few new highs we have relative to most of 2024.
Q&A/Reader’s Feedback
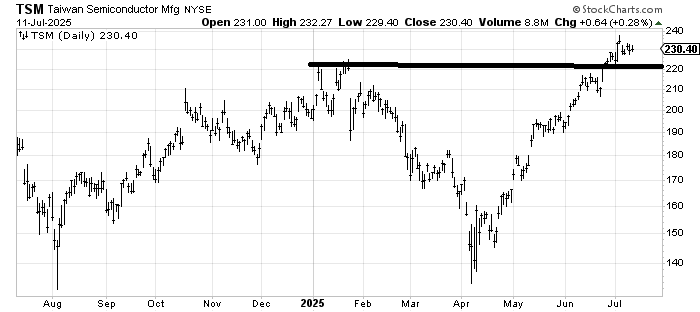
Taiwan Semiconductor TSM hasn’t really done anything wrong. I don’t love that it made a new high and then died, but as long as it stays over 220, it gets the benefit of the doubt. It just feels very over-extended to me.
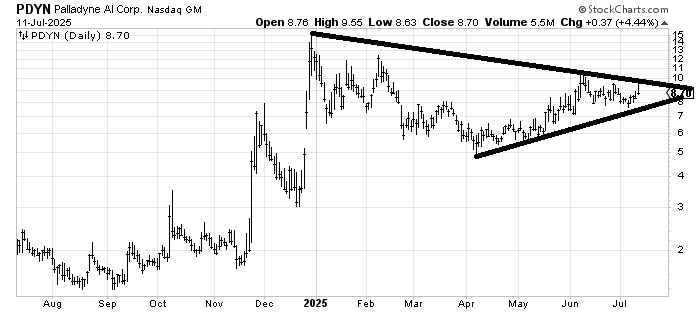
Palladyne AI is shaping up to be a decent chart, having gone sideways for most of 2025. Short term, the action isn’t great, but as long as the stock holds over 7-.50-ish. It’s a good chart.
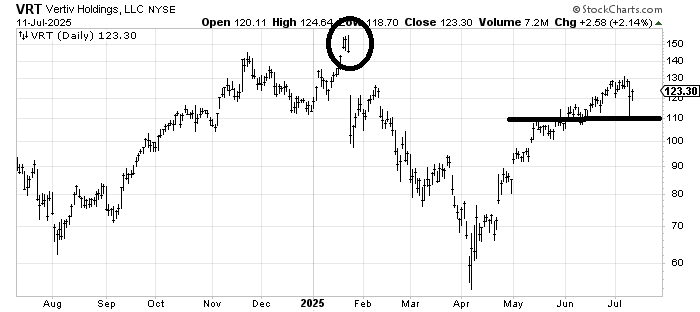
Vertiv VRT is an interesting chart because it had that island in January (circle), and yet this rally off the lows could not fill the gap. It’s not my kind of chart, so I’ll just say that as long as it stays over 110, it gets the benefit of the doubt to fill that gap from January. If it breaks 110, I’d have to look at a move down near 90.
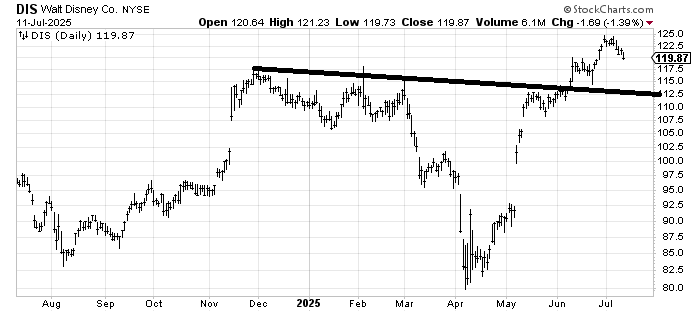
Having fallen nearly every day last week, Disney DIS is probably a little oversold in the short term but my inclination is to have patience and look for a move over the coming weeks/months toward that line around 112-115.
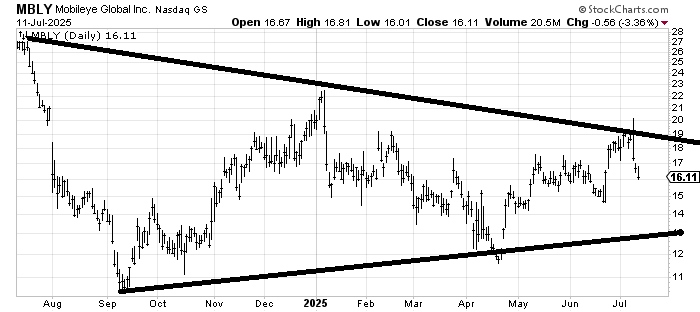
For a stock that trades 20 million shares a day, Mobileye MBLY trades quite thinly. For now, it seems it’s in a wide trading range (12-20) and trying its hardest to form a base. It’s probably a little oversold in the very short term (having come down 20% in three days), but keep bugging me on this because it really could be base building, but it’s just early.
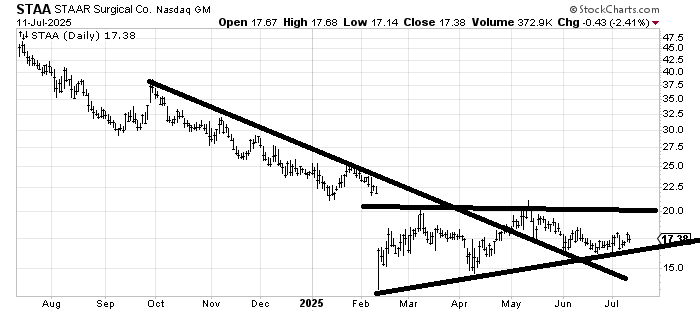
I am intrigued by STAAR Surgical STAA because it has been trying to build a base for five months now. Also, the risk/reward isn’t bad down here because under 16, and you know you’re wrong. It probably takes longer than you have patience for, though!
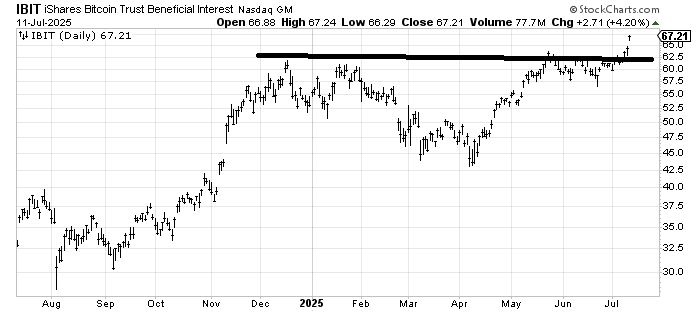
That’s a nice breakout in IBIT, the iShares Bitcoin Trust ETF. It has a short-term target right around here (67-69), so it’s hard for me to chase it. A pullback to the line would be helpful.
Helene welcomes your questions about Top Stocks and her charting strategy and techniques. Please send an email directly to Helene with your questions. However, please remember that TheStreet.com Top Stocks is not intended to provide personalized investment advice. Email Helene here.
