So Many Bulls, So Little Worry
Investors are getting complacent. Does it matter?
You've reached your free article limit
You've read 0 of 1 free Pro articles.
The Market
Well, at least nothing changed much in the market in my short absence!
I will say that, anecdotally, the chatter is more than complacent. On television today, they spent quite some time discussing how poor breadth is and how narrow the market is, but the full complement of guests said it did not matter. Stay bullish, they said.
They even interviewed the chief strategist at Evercore ISI, who is not generally a perma bull, and he reported that in their monthly survey, the number of bulls was –and forgive me here because I might have heard this incorrectly—either the highest ever or the second highest ever. It was either the prior high reading was 69% think the market will be higher six months from now, or the current one is. The other number he cited was 76%. So I’m not sure if it is currently 76% are bullish or 69% (and therefore the other number was the number from 2018). Either way, he said, with a shrug, eh, maybe we get a pullback.
So we have gone from ‘everyone is so bearish, you must buy’ to ‘everyone is so bullish and breadth stinks, but you must stay long’. It’s like heads I win, tails you lose!
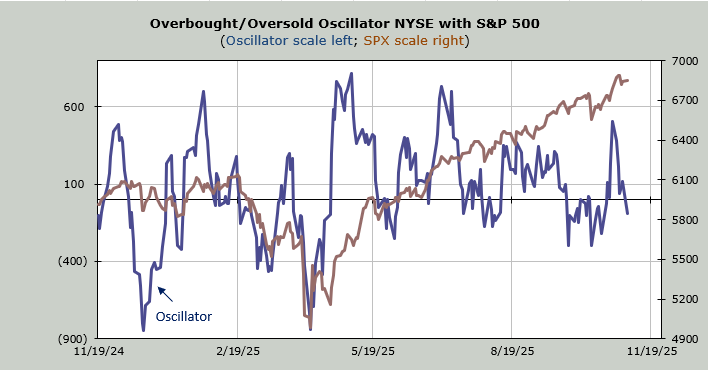
But did any of the indicators change? They did not. The one thing I will highlight is that both the NYSE and Nasdaq have had three straight days with more stocks making new lows than new highs. For Nasdaq, it is the first time since May. For the NYSE, it is the first time since the April lows. But that’s the poor breadth (that they say doesn’t matter!)
From my perspective, I noted before I left last week that if we can get some poor breadth numbers this week, we can get back to a short-term oversold condition. I would still like to see that.
New Ideas
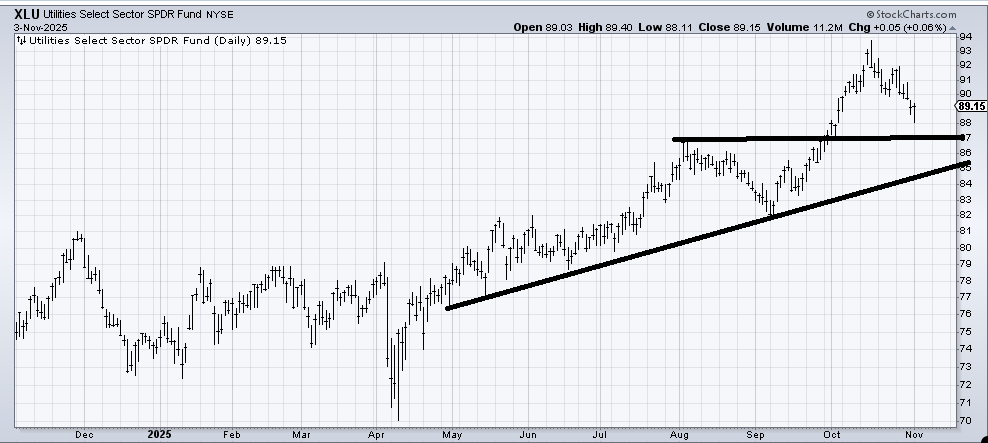
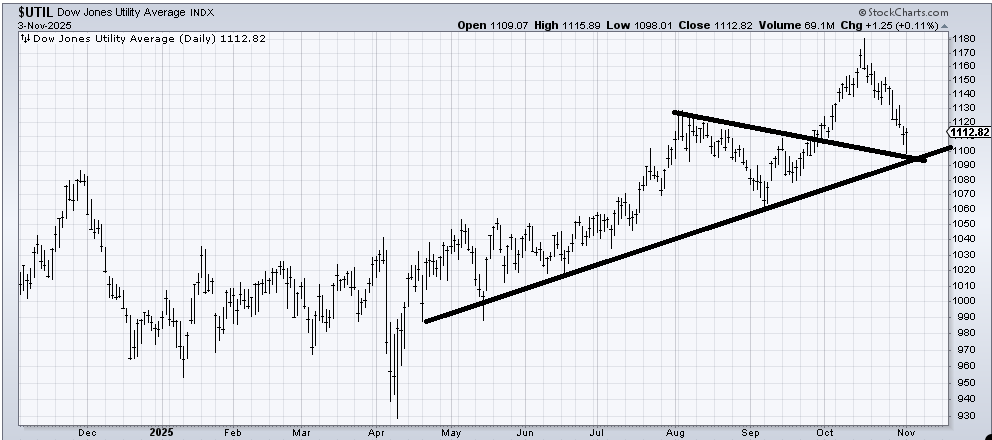
I have had several questions on the Utes. They have pulled back as I anticipated they would, and while I wanted to see XLU tag 87, I think today’s action was close. Maybe they bounce and come down one more time (as they did in early September), but I’d start picking at them again because the actual Utes did, in fact, come down to tag the line I had drawn in.
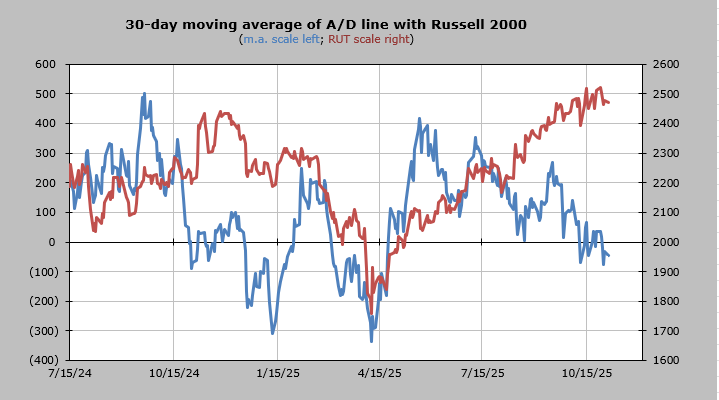
Today’s Indicator
The 30-day moving average of the advance/decline line should ‘bounce,’ but it is not oversold.
Q&A/Reader’s Feedback
Helene welcomes your questions about Top Stocks and her charting strategy and techniques. Please send an email directly to Helene with your questions. However, please remember that TheStreet.com Top Stocks is not intended to provide personalized investment advice. Email Helene here.
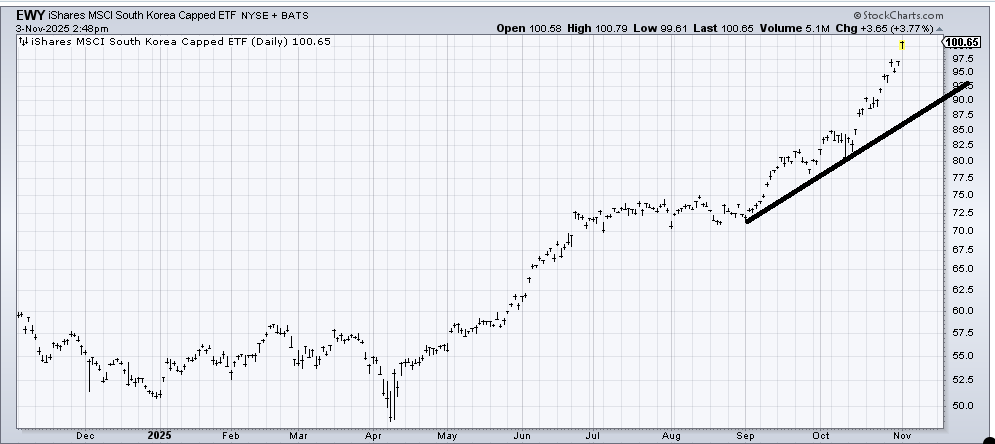
The only thing I can say about (EWI) , an ETF to be long the Korean stock market, is that it appears to be going parabolic. But it has fulfilled the 90/100 rule (90% of the stocks that make it to 90 will make it to 100). It’s not my cup of tea, but as long as that line is not violated, it hasn’t done anything wrong yet.
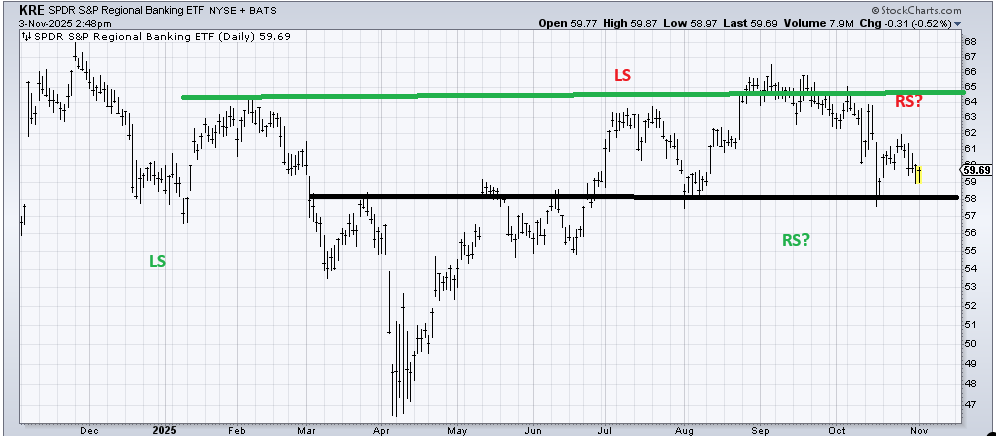
When it comes to the chart of (KRE) , an ETF to be long regional banks, I wonder if I should focus on the potential head and shoulders top (red letters) or the potential head and shoulders bottom (green letters). Thus, I will focus on that 58 area. If it holds, then it remains in the trading range it has been in since July (58-66). If that breaks, we would look at more serious downside targets (starting with 55).
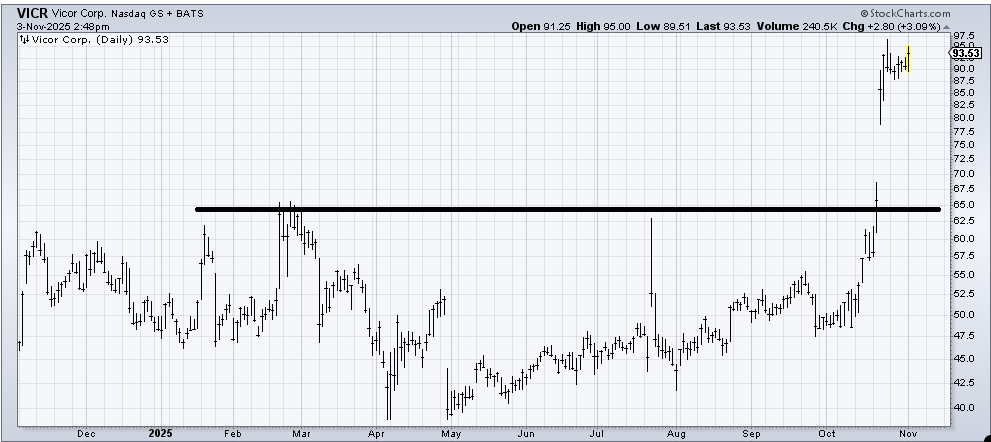
Vicor (VICR) had a nice breakout and was able to maintain it. Now I would say as long as it stays over 90, the 90/100 rule is in effect (90% of the stocks that make it to 90 will make it to 100).
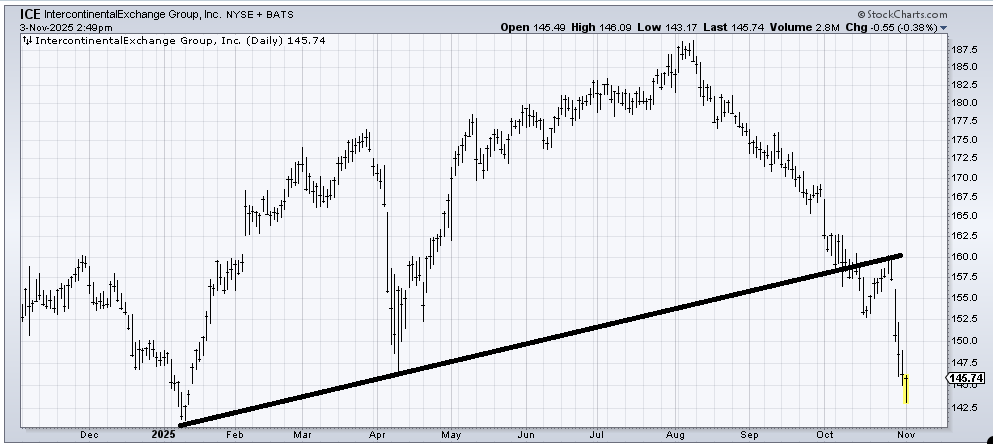
I have had very little luck buying down and out stocks of late. Intercontinental Exchange (ICE) has the chance to rally from this very oversold condition, but there is no base to speak of. And then I think you’d have to fret over tax loss selling. So playing for a bounce now, but that’s it.
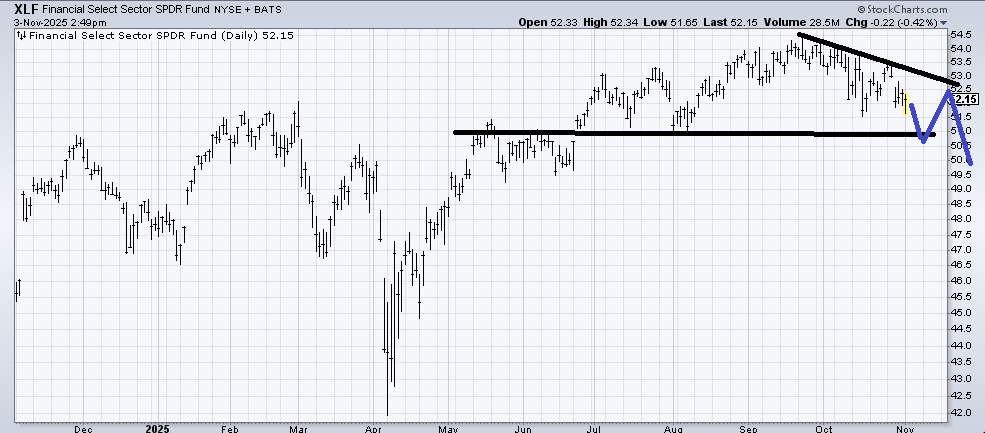
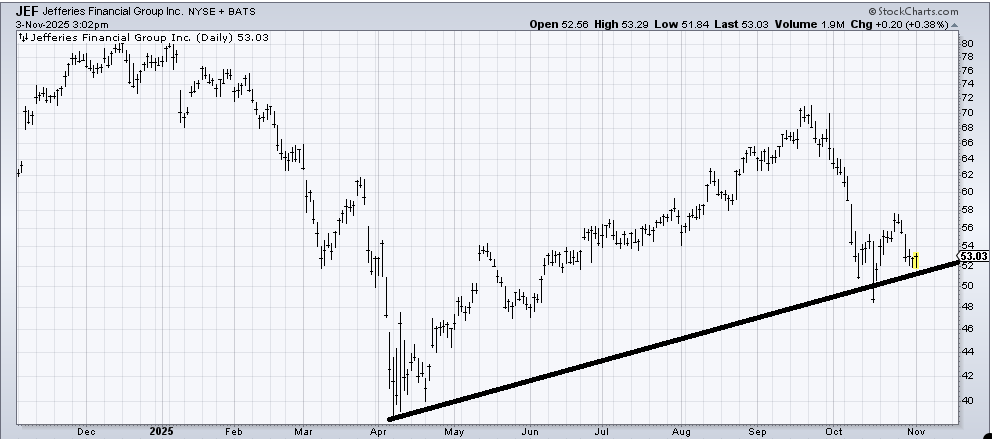
If (XLF) comes down to the black line (51-ish) and bounces as I have drawn in blue, I would worry that it is forming a head and shoulders top. Otherwise, it just looks like a chart trapped between 51 and 54. I keep trying to like the banks, but I don’t see much in the ETF. I would remind you that for a trade, Jeffries (JEF) is mapping out as I drew in a couple of weeks ago.
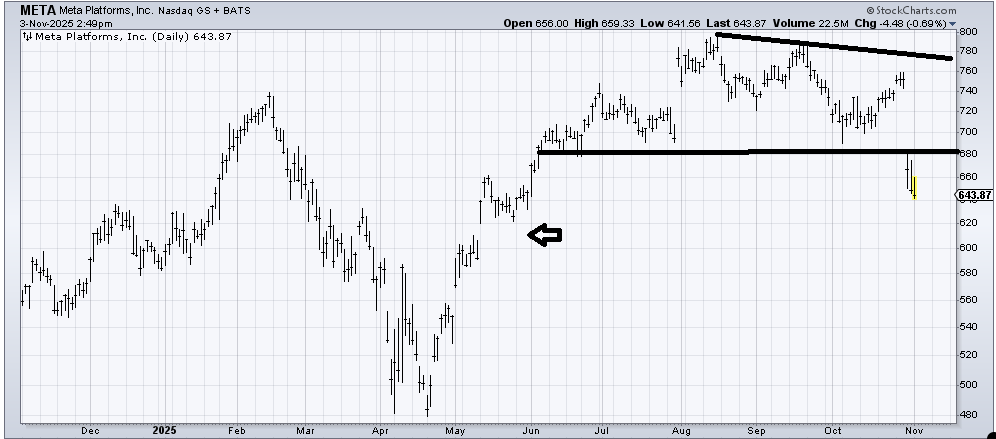
Meta (META) was a big disappointment and has not been able to enjoy a green day since those earnings. It is getting a little oversold now, but that top it broke down from measures to around that gap fill (arrow) on the chart, so for the time being, I think short-term rallies will meet selling.