Since My Last Post on August 23rd, Did the Indicators Change? Let's Look.
There have been some interesting moves in the market. Let's look at the indicators.
You've reached your free article limit
You've read 0 of 1 free Pro articles.
The Market
I looked back at my final post before my vacation, which also happened to be the day prior to the big up day (Friday, August 23rd), and I see that due to the string of down days prior, I thought we ought to enjoy an up day, but I doubted it would change the indicators. I must report that it did not change the indicators.
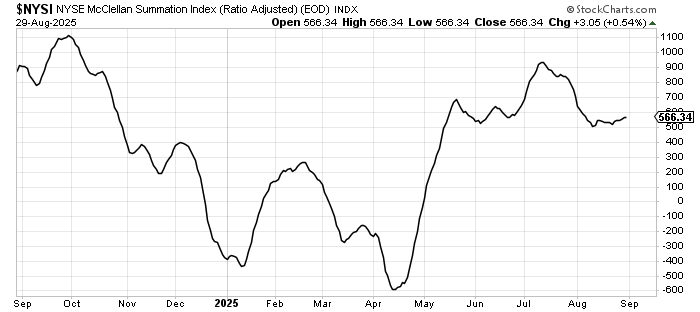
I wish I could say it did, but alas, it did not. The one change was that up volume totaled just over 90% which ought to be bullish overall. But the McClellan Summation Index is still flat. In fact, long-time readers will know I calculate what it will take to change the direction of this indicator daily. I often shrug when it needs less than 500, plus or minus (advancers minus decliners on the NYSE). Today, that number resides at exactly zero. I’m not sure that has ever happened.
What does that mean? It means the rally did not give a boost to the indicator, nor did it detract from it. Perhaps this coming week will be a deciding factor, but so far, we had one big up day and another week of trading, and we got nothing done there.
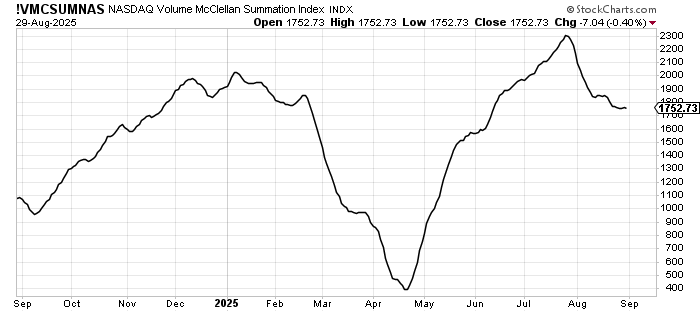
Perhaps more surprising is that the Nasdaq McClellan Summation Index, where I use volume (Nasdaq did not enjoy a 90% up volume day on that Friday), did not halt its current decline, which started a month ago. That still needs a net +3.2 billion shares (up minus down volume) to halt the decline.
But notice something else: the higher highs in the S&P keep getting pushed back almost as soon as they occur. There are still higher lows and higher highs, but typically a 90% up volume day is filled with follow through, it is typically explosive. Not this time. In fact, I see neither Nasdaq nor the QQQs even bothered to make a higher high.
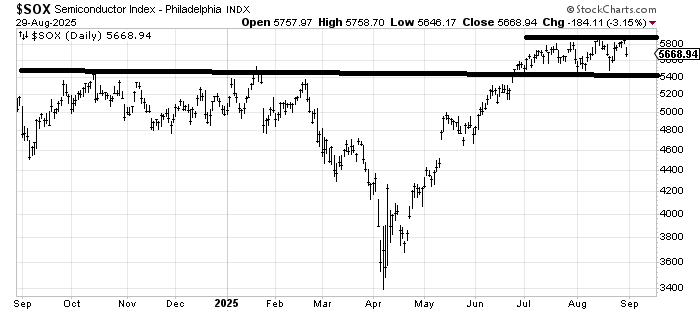
And I see the SOX is in the same place it was in early July. 5400 is still the support area, but when given the chance, it still stops at that 5800-ish area on the top end.
The Utes have done nothing but go down in August, yet no one seems to care (rates anyone?). The Transports still can’t get out of their own way. And surprisingly, the industrials are well off their highs.
But the banks keep on rocking. As do the metals. Small caps are hanging in there, and energy is finally enjoying some love. So the group rotation remains alive and well.
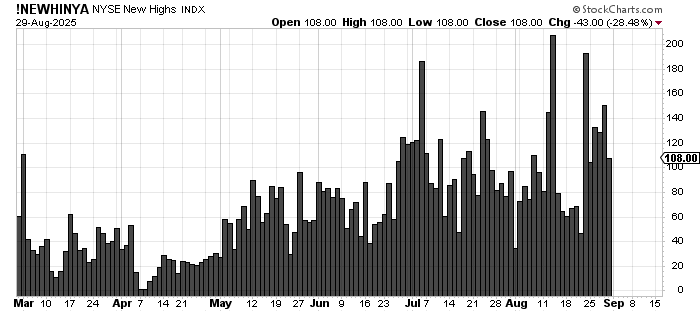
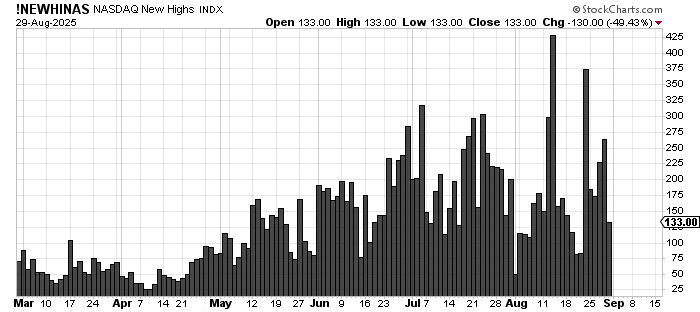
For all the hullabaloo, though, the number of stocks making new highs remains under the mid-August reading and still pretty pathetic. The charts are shown below.
I’m still not sure much has changed in the market. The VIX popped (ought to pop some more). Sentiment remains complacent but not giddy. I believe if we get one or two harsh down days, we’ll start hearing what a scary month September is.
I will always prefer a market that corrects properly, where everything comes down at the same time. If we get that, we can get a proper reset. But so far, the summer has been more like the SOX chart than anything else.
New Ideas
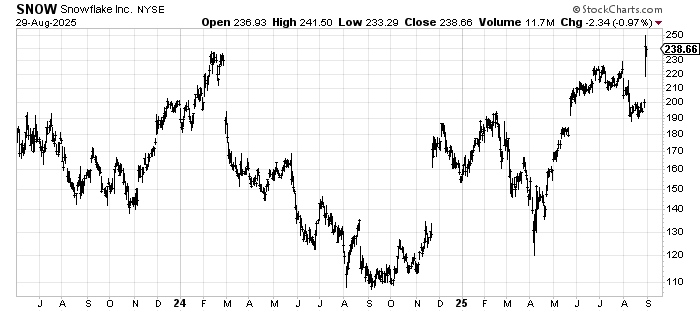
The first thing I need to address is the chart of Snowflake SNOW. When I recommended it a few weeks ago, I said I thought it was ‘just a trade’. I expected it would rally into resistance and come back down. I did not expect it would gap up over those summer highs and even challenge the early 2024 high. Yet that is exactly what it has done. There is a next measured target around 270 now. It’s hard to determine a stop because it would be so far away. In this market, I would opt to take a few profits up here just in case, since so many gaps up like this have not had a lot of follow-through.
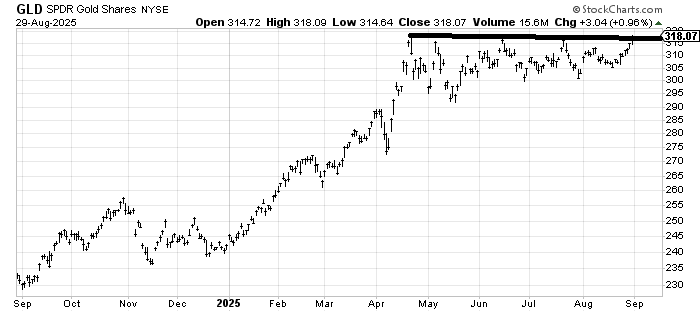
Next, I need to address GLD, an ETF to be long gold. I maintain that as long as GLD does not break under 300, it is okay. But now the test is if it can crack over 320 and hold it. It has tried to get over it four times since it first got there in April and has failed to do so. The DSI is currently 79, so there is room for it to do so. If it does, I believe the likely scenario would be a breakout with a quick run toward, say, 330, maybe even 340, with the DSI getting to the upper 80s, maybe even 90, and then we’d see it come back down again. In other words, the DSI gives it some room to rally but not a super long runway.
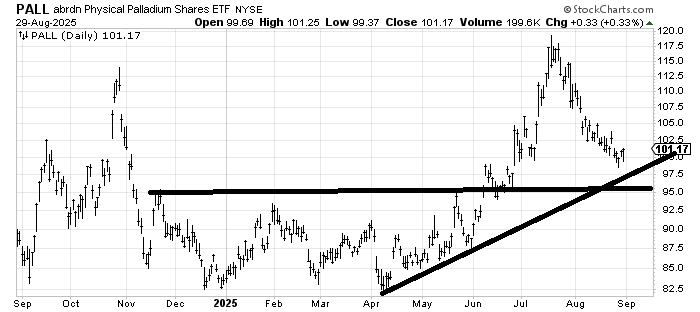
Finally, a reminder that PALL is coming into that support/buy area we looked at a few weeks ago.
Today’s Indicator
The new highs are discussed above.
Q&A/Reader’s Feedback
Helene welcomes your questions about Top Stocks and her charting strategy and techniques. Please send an email directly to Helene with your questions. However, please remember that TheStreet.com Top Stocks is not intended to provide personalized investment advice. Email Helene here.
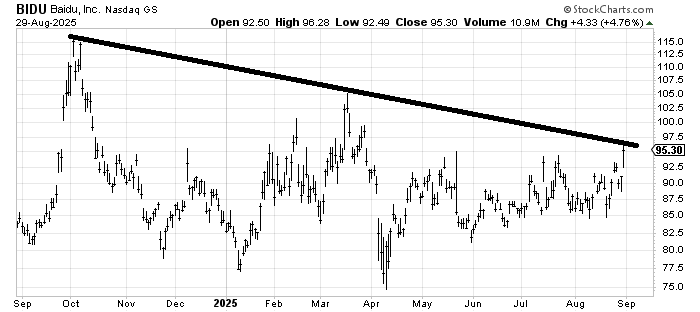
I think Baidu BIDU is working on a base. It also has resistance here and from that spike in March. I cannot decide if it will cross the line, run into that spike high and pull back, or if it will retreat and then make another (successful) run to get over the line. I would prefer the former over the latter.
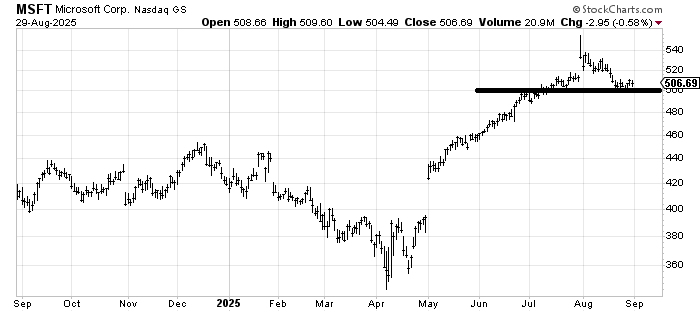
I don’t love that Microsoft MSFT more than filled its earnings gap, nor do I love that it pulled back over ten percent from that gap. But the stock is holding this 500 area, so as long as it can hold this area, this ought to turn into a correction and not much more. A break of this general support (500-ish) would have me rethinking that view.
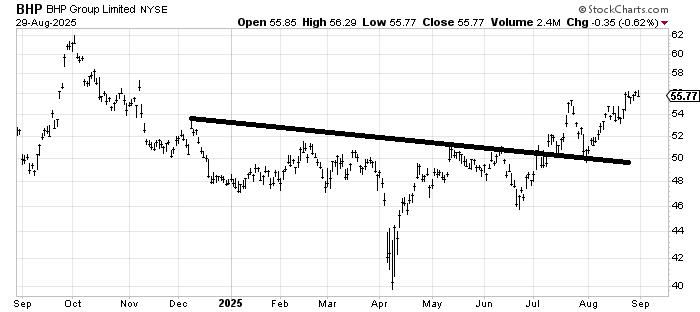
BHP BHP is an interesting chart because it formed a pattern I tend to like: breakout over a line and a retest of the line (see July). And that base measures to the 62 area, which is the high you see from nearly a year ago. Short term, it is tired, but it ought to work its way up there over time.