Should We Be Looking Back to the Dotcom Craze or to 2021?
There are many similarities in the current statistics to 2021, but perhaps the Dotcom boom is the better comparison.
You've reached your free article limit
You've read 0 of 1 free Pro articles.
The Market
We remain in a sideways market for the last two weeks. There has been plenty of action in individual stocks but not much in the overall indexes. Even the Russell 2000, where so much of the action is supposed to be, has stagnated.
There is something else that I have noticed. There are a lot of statistics being floated around that then have the tag line: not since 2021. Many are quick to compare this market to the SPAC craze that peaked in the first few months of 2021, but I tend to believe markets rarely repeat something that is so recent in investors’ minds.
Is this more like the dot-com craze? A bit. And I only say that because if we think about what has rallied the most, it is so concentrated in all that ‘new economy’ stuff like rockets, AI, and crypto. But it is not the same because banks have done well. And mining. Mining!
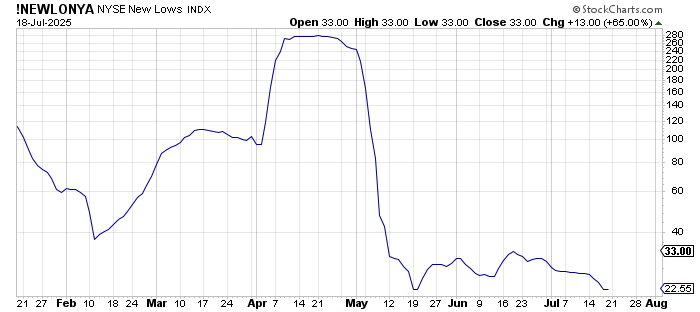
The indicators did not change much last week. The McClellan Summation is still heading down and requires a net differential of +1100 advancers minus decliners on the NYSE to halt the decline. The Hi-Lo indicator is pointing down as well. I am watching the new lows carefully because the ten-day moving average has turned upward.
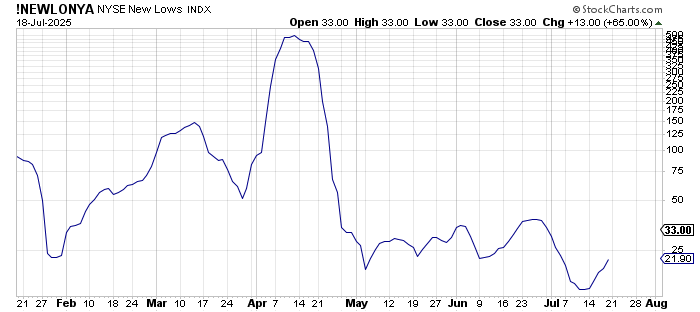
Yet the 20-day moving average is flat. My estimation is that the 20-day moving average could turn up this week if we get a repeat of last week’s action (chop with selling underneath).
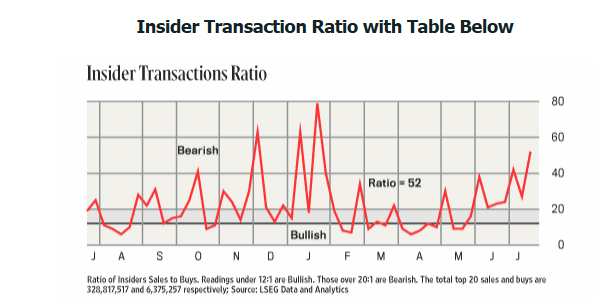
A few weeks ago, we looked at the chart of the Insider sell-to-buy ratio. It has been moving higher since May, with higher highs and higher lows. The timing of this metric is poor, meaning if you tried to match it up to an index you’d find very little correlation, but my observation over the years is that this tends to get up to these levels and the market needs a reset---it needs enough of a pullback to get the buyers more interested than the sellers.
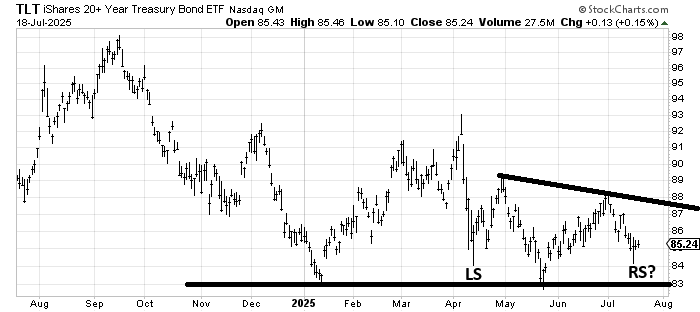
While I continue to think interest rates will remain in a wide range, I have been asked if I see the head and shoulders bottom (potential) in the iShares 20+ year Treasury Bond ETF TLT. I do. It feels to me as if we need a little scary move first, though.
New Ideas
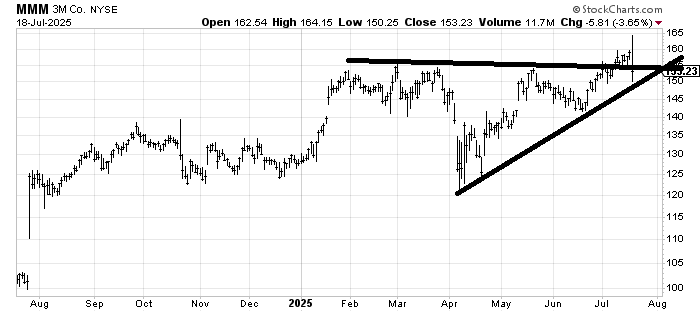
3M MMM had quite a reversal on Friday after its earnings. Let’s see if it can settle down in this area. I do not want it to break under 150.
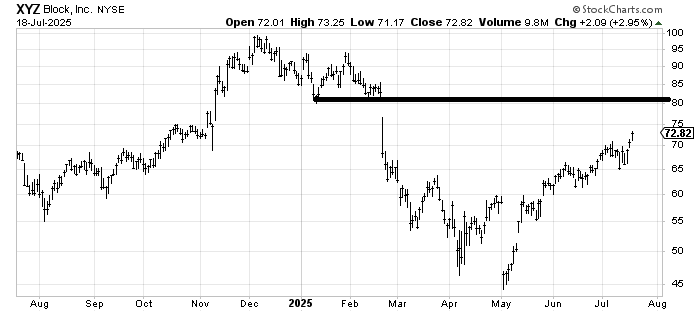
After the bell on Friday, our old friend Block XYZ got the nod to be added to the S&P. As a reminder, my target has been to fill that gap in that 80-ish area.
Today’s Indicator
The Hi-Lo Indicator and new lows in particular are discussed above with their charts.
Q&A/Reader’s Feedback
Helene welcomes your questions about Top Stocks and her charting strategy and techniques. Please send an email directly to Helene with your questions. However, please remember that TheStreet.com Top Stocks is not intended to provide personalized investment advice. Email Helene here.
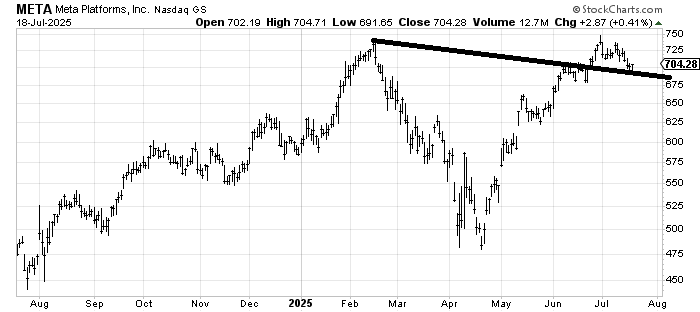
I was asked to follow up on Meta META, which we looked at a week or so ago. I noted at the time that it tended to play possum into earnings often, pulling back before and then jumping after. I think Meta can/should bounce off this line, but I don’t have a strong view on whether or not it bounces well. It feels a bit similar to Netflix, which bounced before earnings and then went plop after earnings.
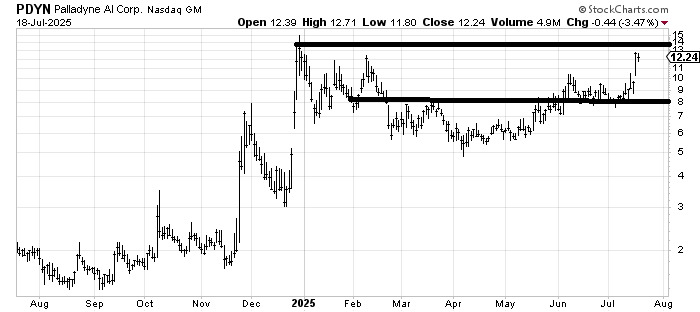
I was asked to follow up on Palladyne AI (PDYN), which I was asked about last week (now that it’s popped). There is some short-term resistance around 13-14. My only problem is that support is now back at 10-ish, which is 20% away. My suggestion would be to take a few profits and hang on to the rest for now.
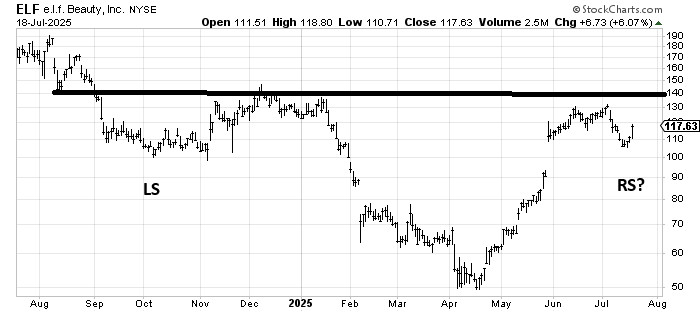
In the near term, e.l.f. Beauty ELF looks like it could go sideways for a while (see how long it went sideways last fall). But in the bigger picture, it seems to be building a base. As one who loves a good gap fill, I’d love to see a whack to 90-95 in the next month, but if you have patience, it’s a decent chart.
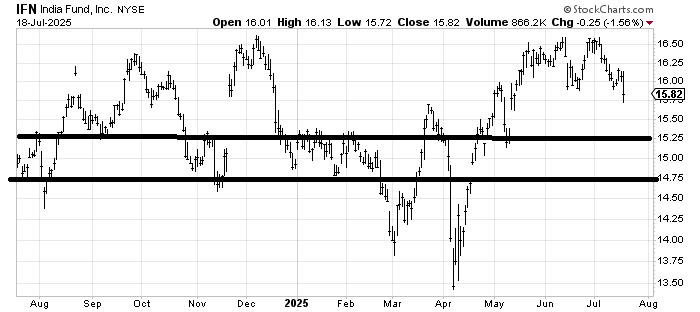
India Fund IFN is rolling over, and I suspect, even if it bounces this week, it will eventually make its way down to that support area I drew in (14.75-15.25). It’s got a great yield, so unless there is something dramatic that happens globally or specifically with India, I would expect that area would make this a buy.
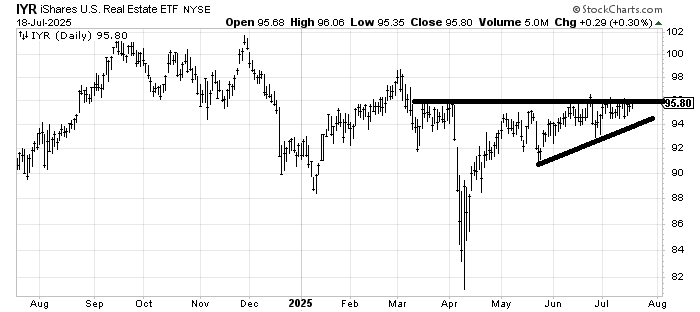
The Utes have rallied, and the Homies have rallied, but the REITs, another interest rate-sensitive group, have been sidelined. Their yield is not that high anymore, so the attraction to them might be waning. If they get up and over this 95 area, then TLT is probably the better play.