Should Traders Fret Recent Palantir, Robinhood, and Coinbase Dips? Let's Check the Charts
The three stocks have pulled back, so let's see where they could be headed next.
You've reached your free article limit
You've read 0 of 1 free Pro articles.
First Trader: Hey, I think my monitor’s broken!
Second Trader: Why? What’s wrong?
First Trader: All my stocks are red!
OK, that’s the oldest joke in the book. But let’s face it, we’ve been spoiled. The S&P 500 gained 26% in 2023, and 25% in 2024. So far this year, the large cap index has gained 9.6%.
The Nasdaq Composite has outperformed the S&P 500, gaining 43% in 2023, 28% in 2024, and 12% year to date.
In the markets, what goes up doesn’t necessarily have to come down, but pullbacks are a normal part of business. Both the S&P 500 and the Nasdaq Composite are off their highs, but both have also formed the bullish reversal candlestick pattern known as the hammer (arrows).
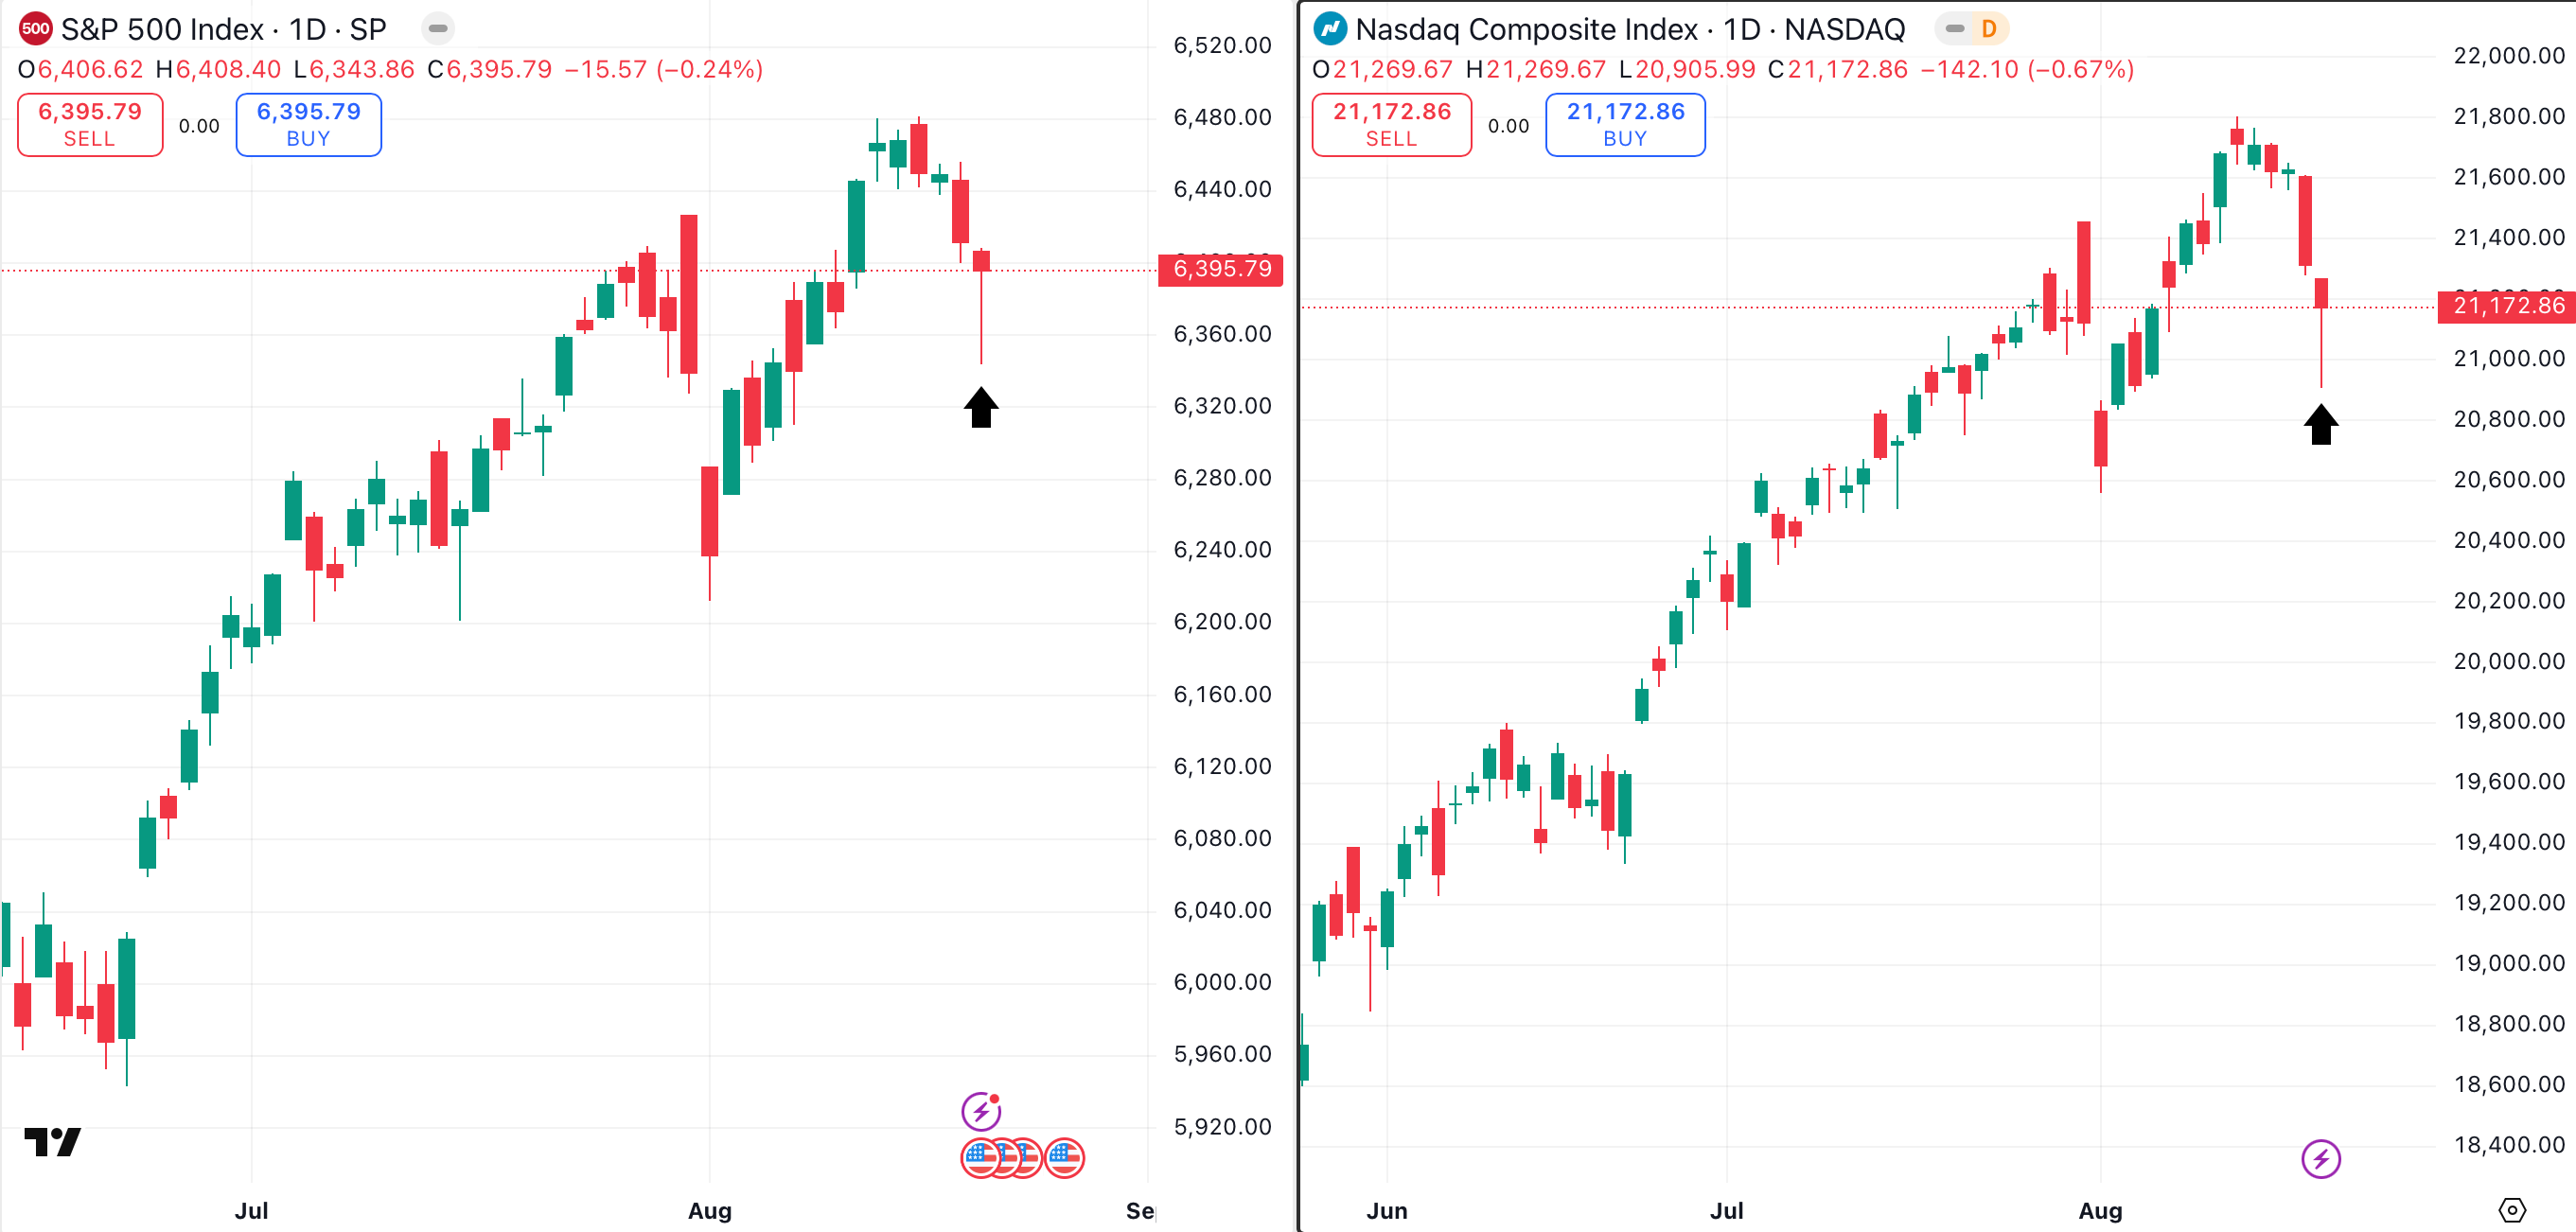
What would be more bullish than dual hammers on the two most important U.S. stock indexes? Well, if the hammers were green, that would indicate a close at or near the high of the day. Still, the long wicks indicate a vicious intraday reversal, the memory of which may keep the bears at bay, at least for now.
How has this price action affected some of our favorite stocks? Let’s go to the charts to find out.
What Goes Up: Palantir
Shares of Palantir have gained 107% so far this year, and 382% over the past 12 months. With those huge gains in hand, it’s no surprise that this pullback has chopped 20% from Palatir’s value. Despite the pullback, the stock’s bullish trend remains intact.
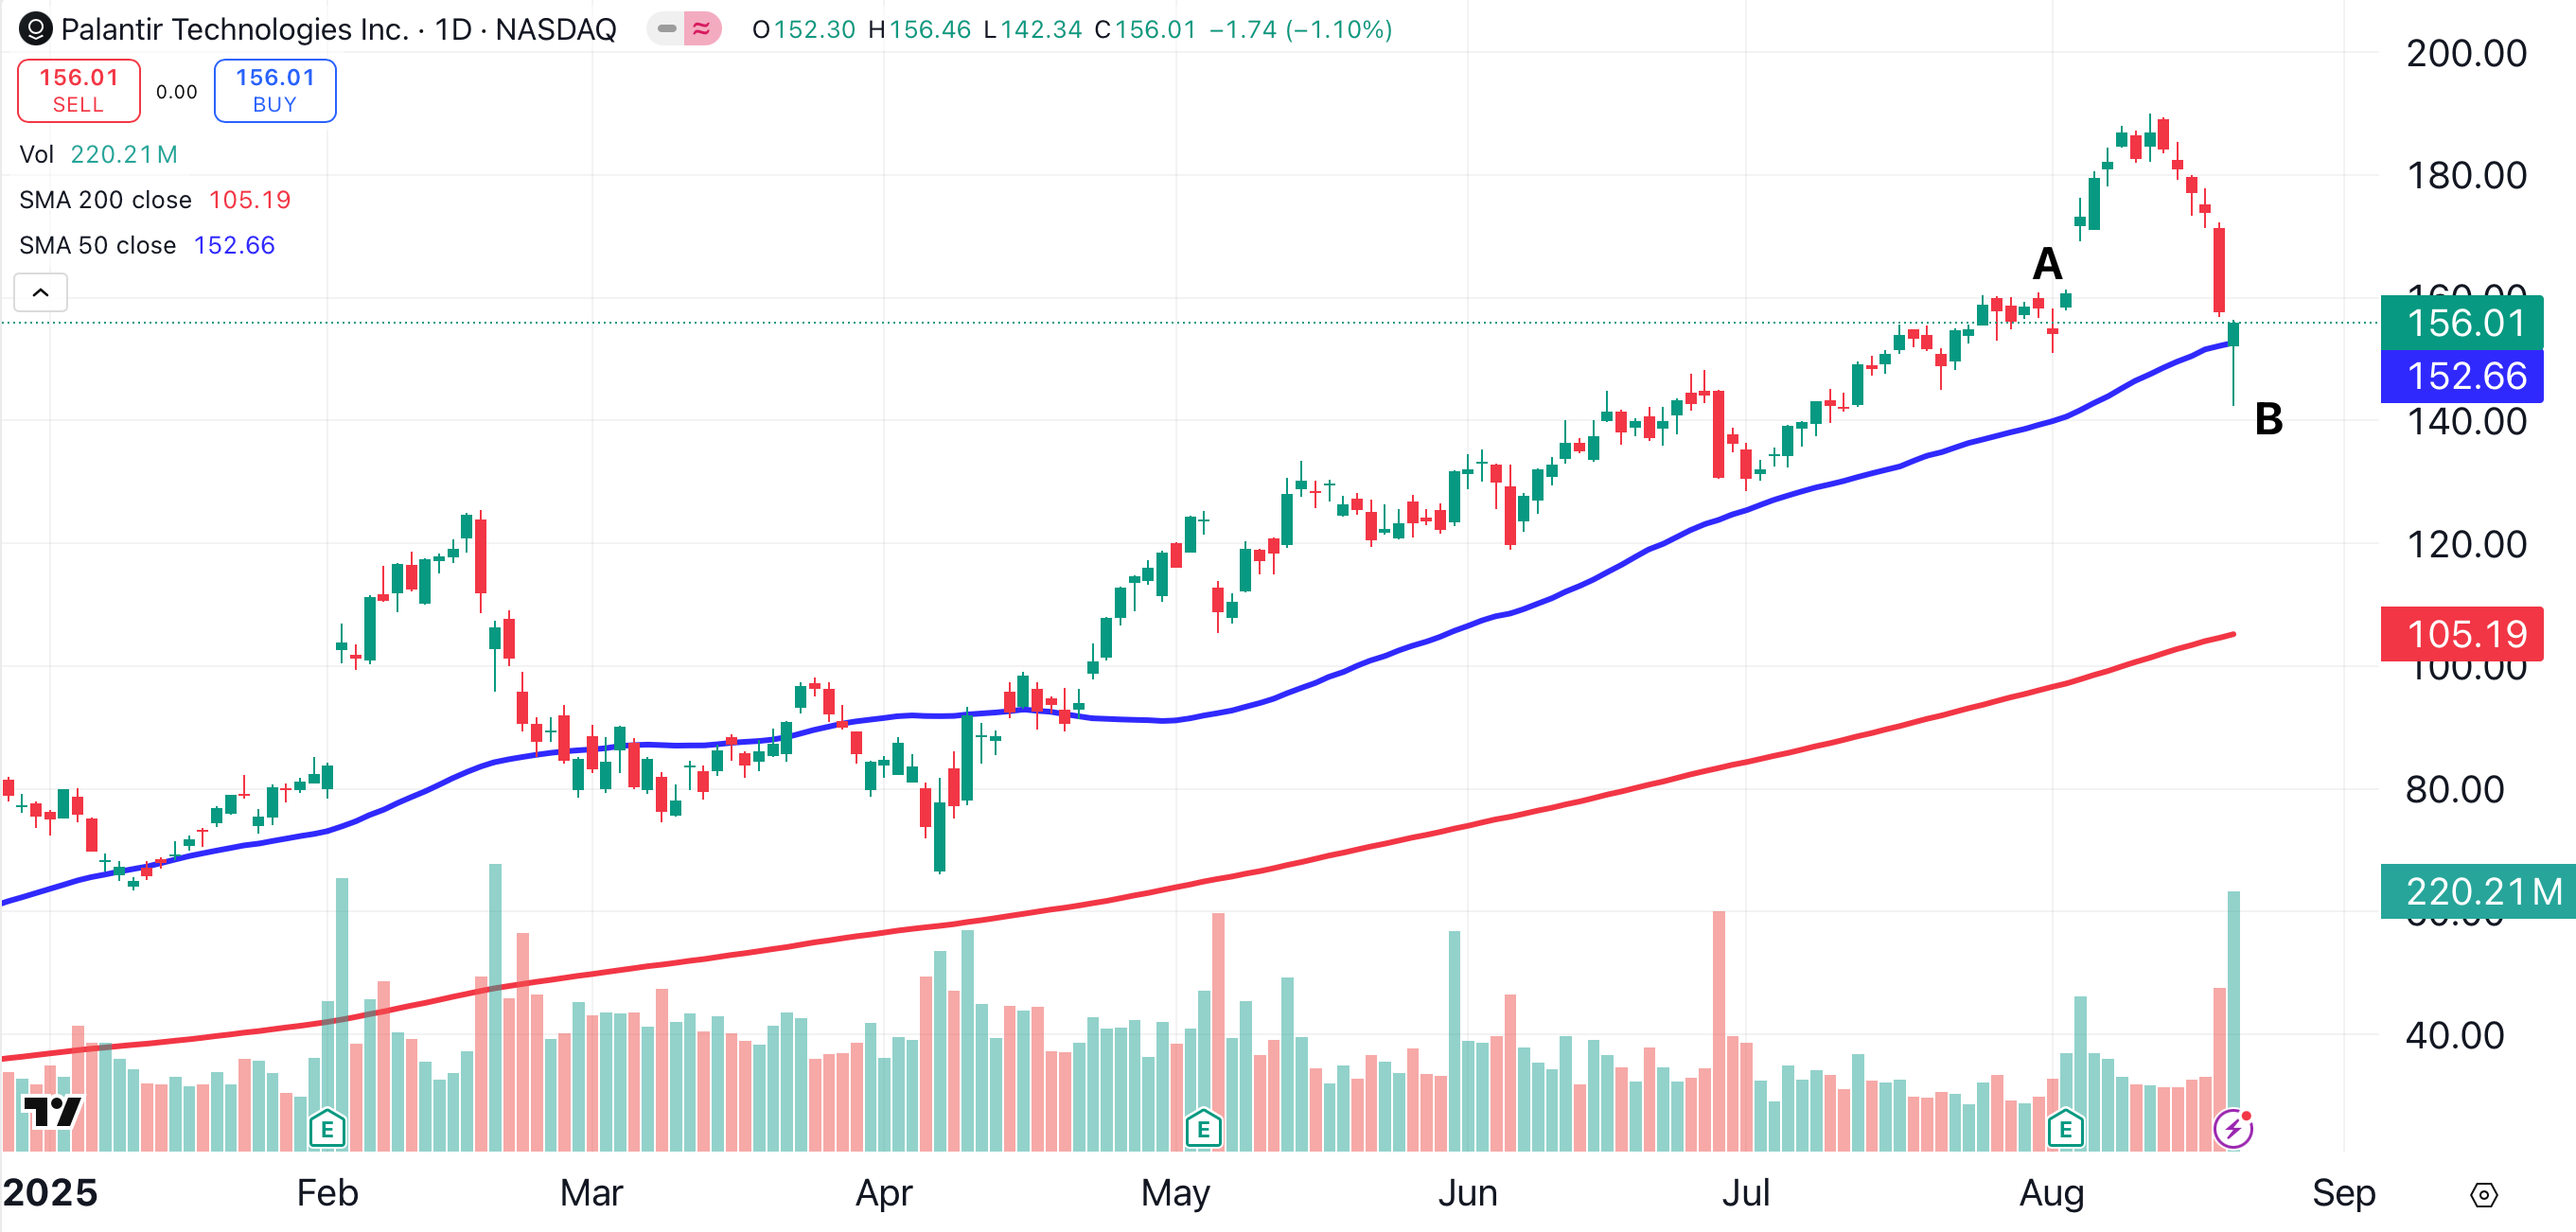
Palantir has now filled its Aug. 6 post-earnings gap (point A), and found support on its 50-day moving average (blue), where the stock formed a green hammer on Wednesday (point B). This leads me to believe that a bounce is in order.
CONCERN LEVEL: MILD
Robinhood's Moves
Robinhood is arguably stronger than Palantir, as it hasn’t recently come into contact with its 50-day moving average (blue). This stock also formed a hammer (arrow) on Wednesday. Although Robinhood couldn’t duplicate Palantir’s green hammer, the long wick tells me that the bears felt the pain (arrow).
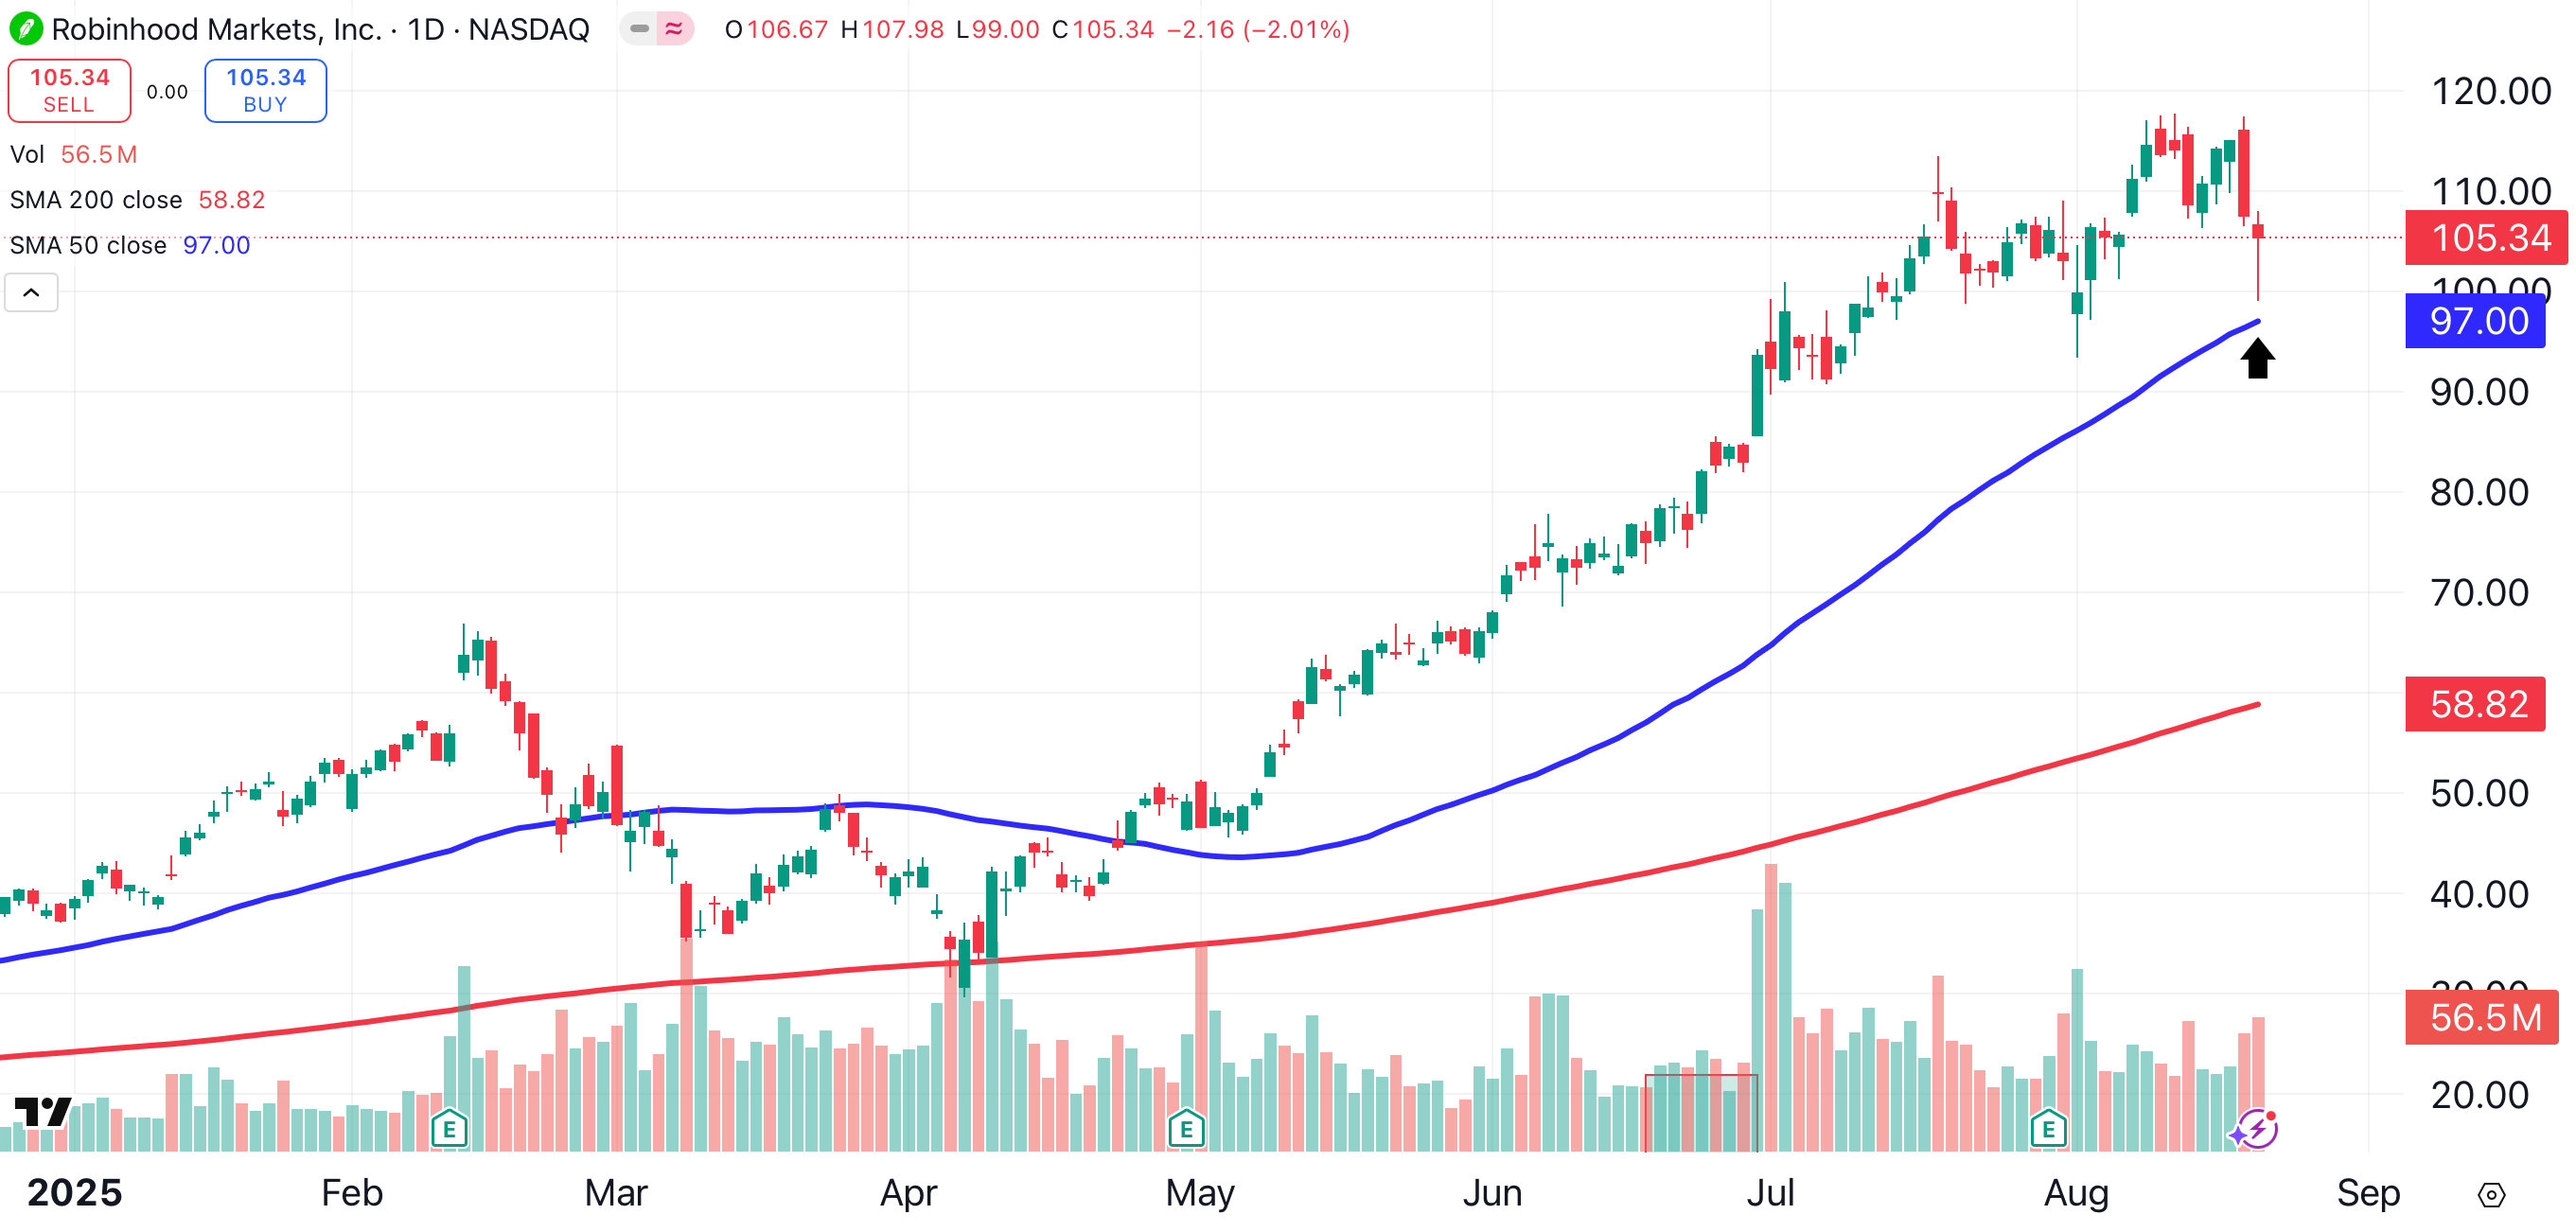
CONCERN LEVEL: MILD
Coinbase Conundrum
Coinbase is following classic charting dogma, as former resistance (point A) is now acting as support (point B). Notably, Coinbase has failed to close above its 50-day MA (blue) this month.
Worse, a head and shoulders pattern (L-H-R) appears to have formed.
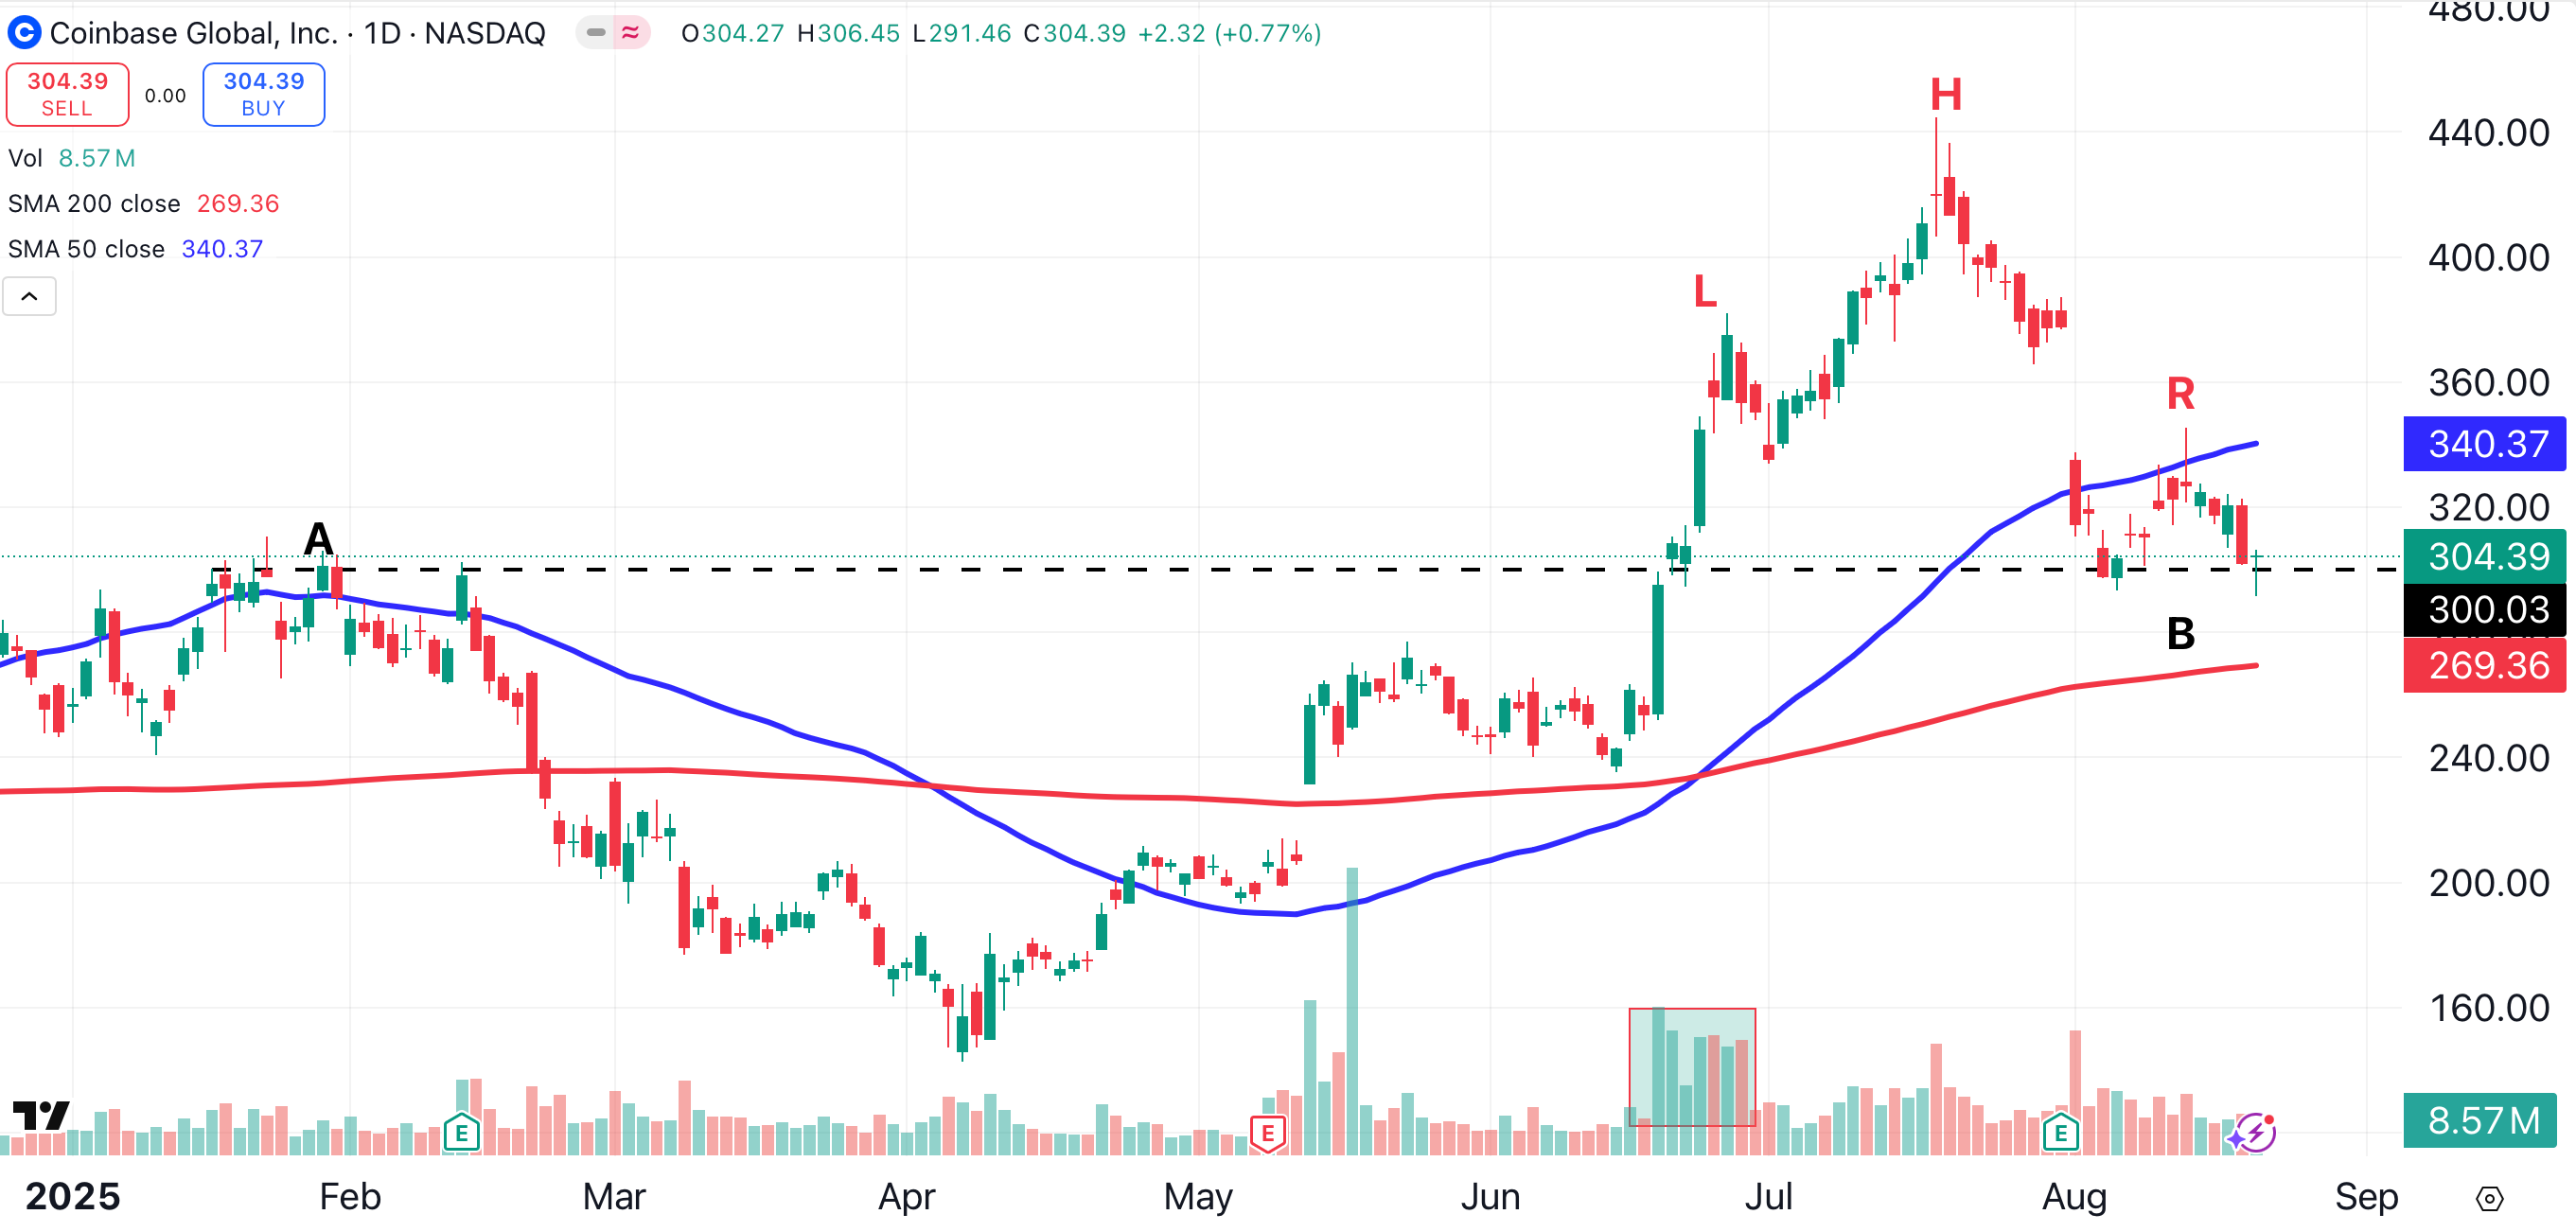
CONCERN LEVEL: HIGH. If Coinbase breaks below its 200-day moving average (red), currently just below $270. I’ll consider selling the stock.
At the time of publication, Ponsi was long PLTR, HOOD, and COIN.
