Should Investors Take President Trump’s Advice and 'Go Out and Buy Stocks Now'?
The S&P 500 and the Nasdaq Composite are flashing uncertainty despite the president’s bravado.
You've reached your free article limit
You've read 0 of 1 free Pro articles.
On Thursday, after signing a trade deal between the U.S. and U.K., the President of the United States offered investors these words of advice:
“You better go out and buy stock now,” said President Trump. “Let me tell you, this country will be like a rocket ship that goes straight up.”
A Month-Long Rally
While President Trump may be correct, one look at the chart tells us that this advice might have been more helpful one month ago. Since the April 9 opening bell, the S&P 500 has gained 14%, and the Nasdaq Composite has climbed 17%.
Those solid gains occurred while the U.K. deal, and other trade deals, were still in the negotiation process.
Looking at these outsized gains, it seems possible that some details of the U.S./U.K. deal leaked out in advance. It’s not difficult to imagine word of an imminent deal getting out prematurely, from either Wall Street or Canary Wharf.
💵💰 Join us for TheStreet's Live Quarterly Meeting on May 14th 💰💵
Buy the Rumor, Sell the News?
If that’s the case, then some of the gains from this trade deal may have already occurred. If New York or London-based institutional traders had an inkling that this deal was coming, they likely bought stocks weeks ago. This situation causes the news to be “priced in” by the time it becomes public knowledge.
Now that the rest of the world knows, is this a buy the rumor/sell the news situation?
Charts Reveal Uncertainty
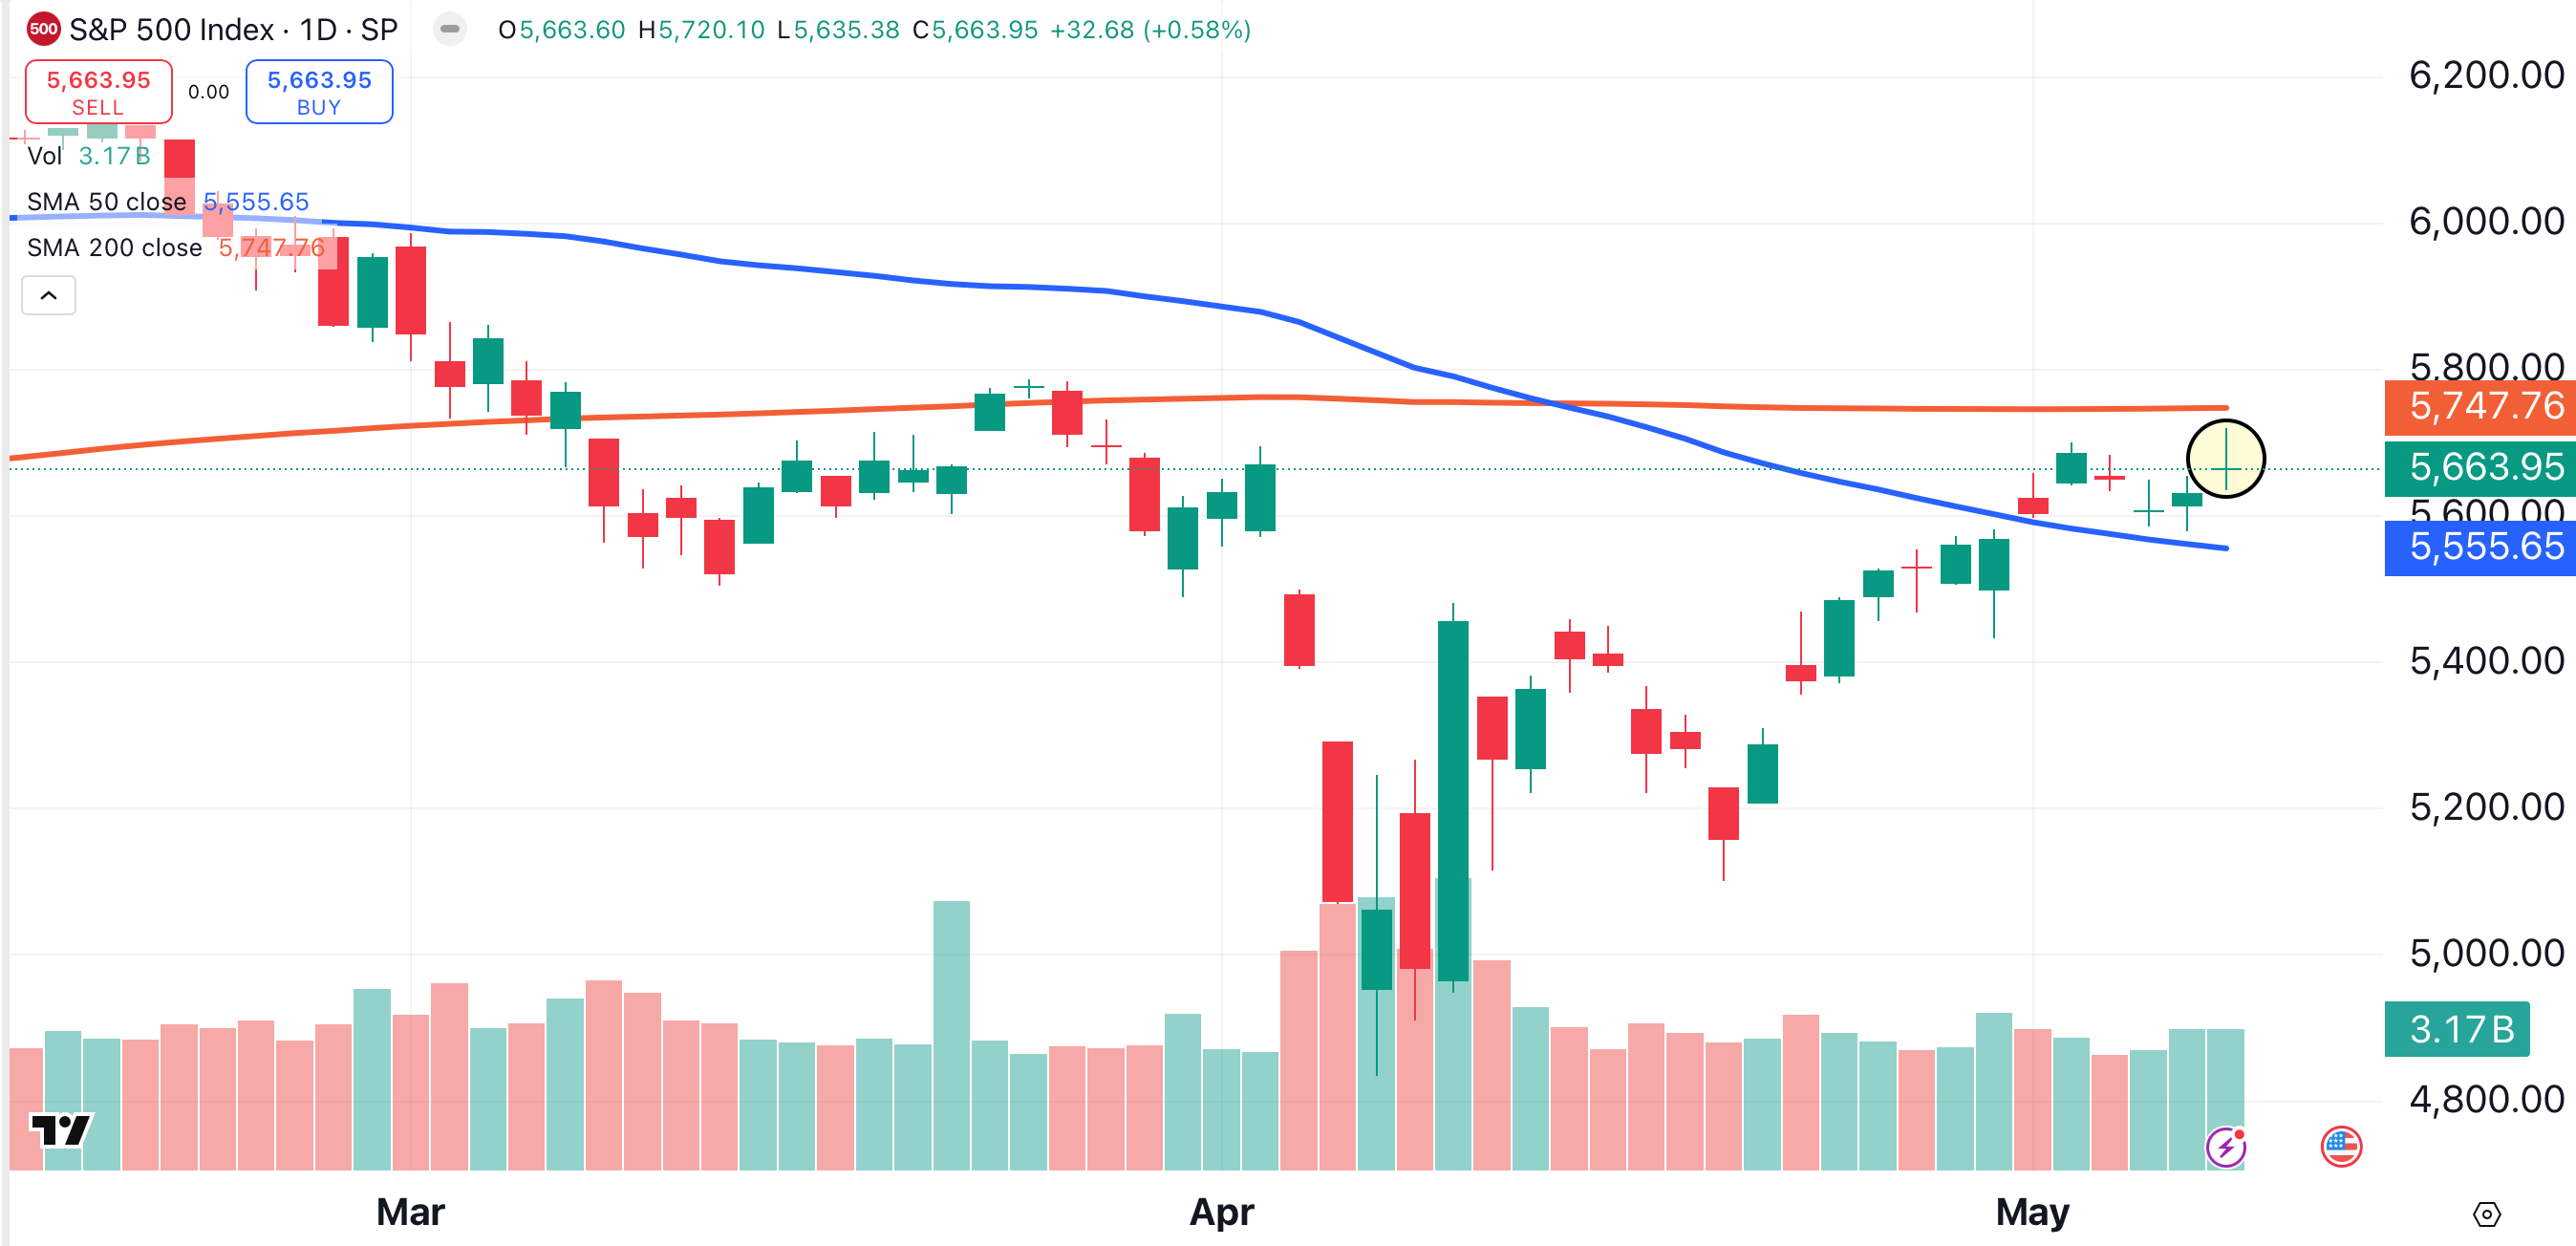
On Thursday, the S&P 500 formed a doji candlestick pattern (shaded yellow). A doji looks like a small cross, and is formed when the opening and closing price are nearly the same.
The doji pattern is neither bullish or bearish; it merely represents uncertainty. Three of the last five S&P 500 candles qualify as dojis.
The Nasdaq Composite also formed a doji on Thursday. The tech-heavy index’s last half-dozen candles all feature small bodies, This is cautious price action, and it comes after the index racked up a 17% gain over the past month.
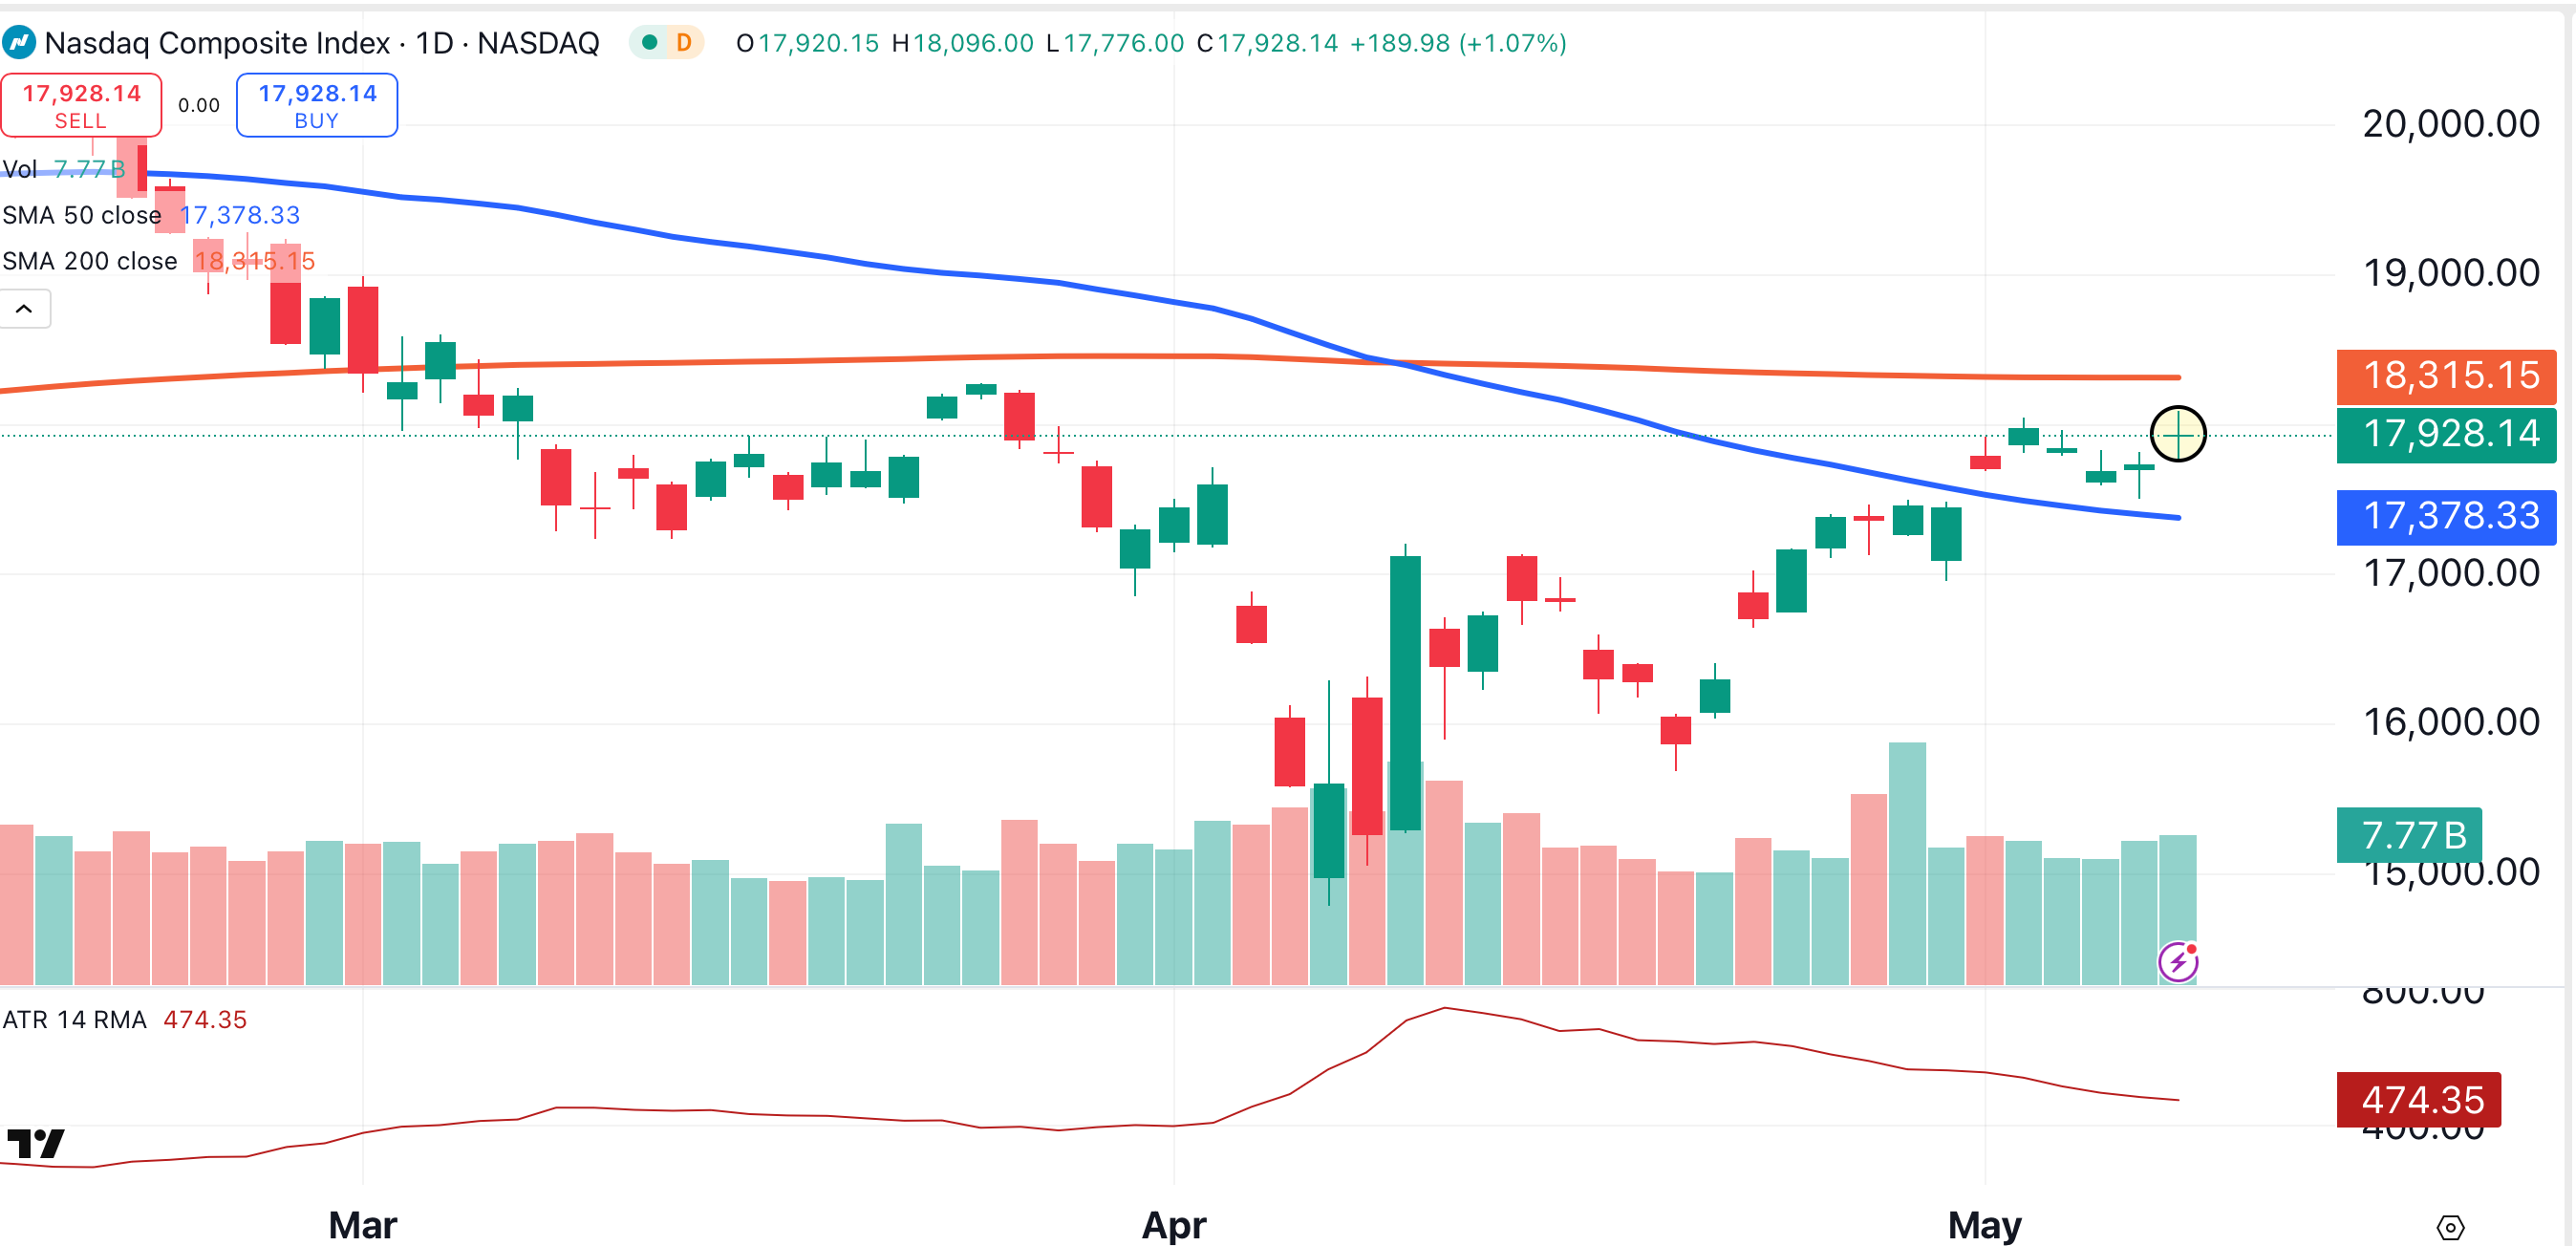
I’ve also added ATR (average true range) to the Nasdaq Composite chart. The declining thin red line at the bottom of the chart indicates that volatility, while still relatively high, has been slipping in recent weeks.
The Bottom Line
The big pre-news rally, and the uncertainty that markets are demonstrating after the news of the trade deal became public, could be considered caution flags. Even though the trade news is positive, the market’s reaction leads me to believe that some of the juice has already been squeezed out of this trade.
If you do buy here, be aware that you’re buying right after a 14% S&P 500 rally, and a 17% Nasdaq Composite run. It might work, but I still prefer buying pullbacks. Let’s see if we get one.
