Short S&P 500 ETF Is Flashing a Market Top
Trading volume is picking up in one short ETF that has a decent record at predicting market declines.
You've reached your free article limit
You've read 0 of 1 free Pro articles.
Some of you probably remember that I created a volume indicator called Normalized Relative Volume or NRV. Without getting into the weeds on how it's calculated, it normalizes the security's volume two ways: first, versus its own history and then versus the market's total volume.
It can be useful in finding turning points.
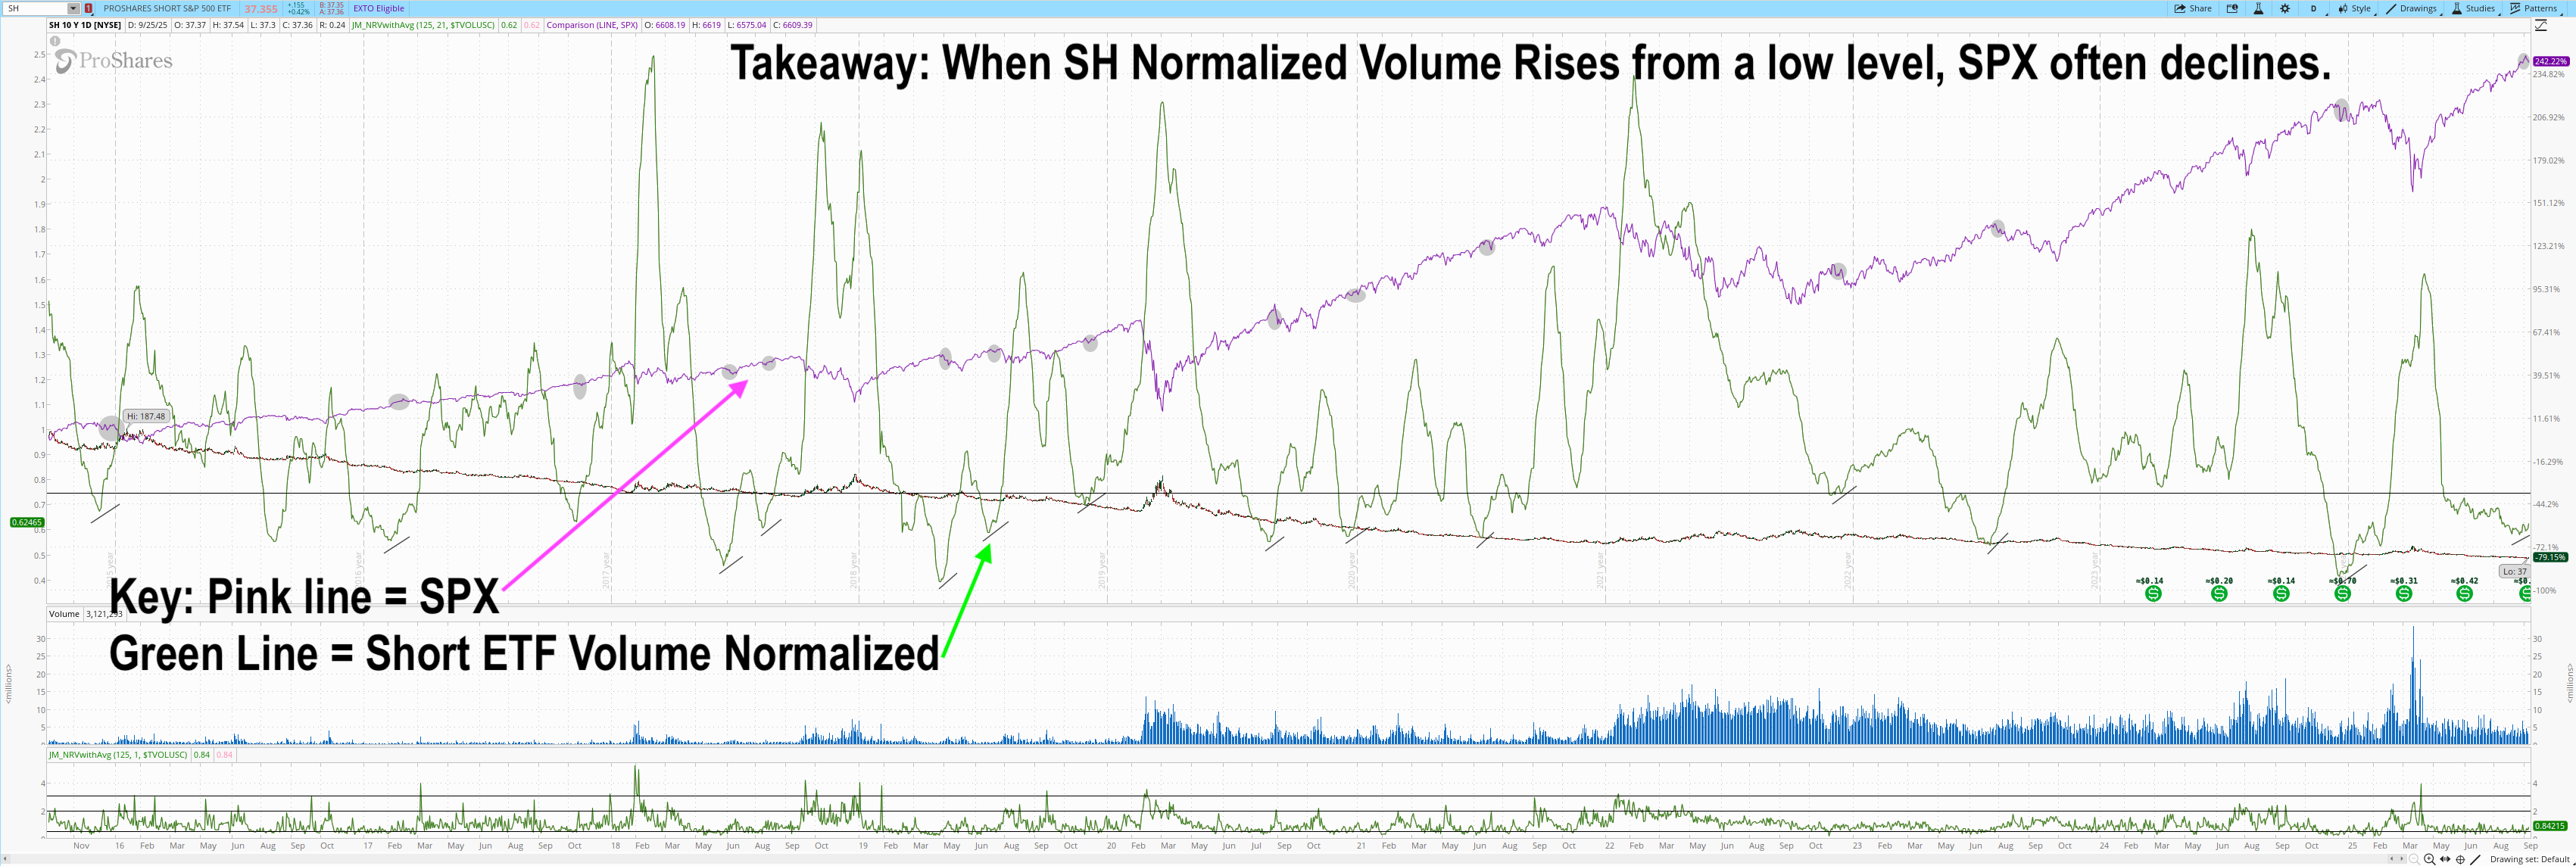
In the chart below, I've calculated NRV on the ProShares Short S&P 500 ETF (SH) . I've also smoothed it over 21 days, which gives an intermediate-term signal. The unsmoothed version is at the bottom.
I like to look for tops when the indicator turns up from below 0.75, which it's currently doing. I've highlighted all of the past instances in the chart. Some have been good trades. Others, not so much. About nine out of 14 have resulted in good trades.
Will this time around be a good trade? I don't know. This is a tough market to short. But I think it's worth adding to your arsenal and wanted to share.
