Sentiment Got Panicky Right After Liberation Day
But where are we now?
You've reached your free article limit
You've read 0 of 1 free Pro articles.
The Market
Being contrarian is not always correct. There is what I call the extremes and the middle. At the extremes, the majority is wrong, but then there is this entire middle where we haven’t really converted the last bull or bear.
Think of that from a month ago. The market was down quite a bit. It felt like the semis and technology in general would never stop going down. It FELT like everyone was bearish. Yet I wanted panic. I wanted to see all the sentiment indicators get extreme, not just a handful, and not just the chatter.
At that point, the AAII bears had been hovering around 60% for nearly 5-6 weeks. And from that first reading at 60% in late February (yes, they got bearish FAST), everyone wanted to fade them, yet it took nearly two months to get the other indicators to push to an extreme.
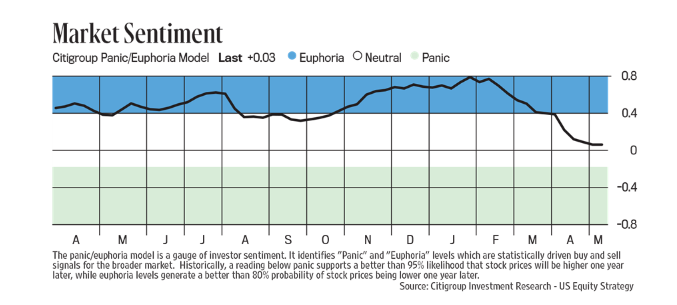
Think of the Citi Panic/Euphoria Model that moves so slowly you might think it doesn’t work. Its timing isn’t the best, but I like it because of how slow-moving it is. It takes a lot to fall out of Euphoria. It didn’t fall out of Euphoria until early April. It is still hovering just over the zero line, never having even gone into Panic. But, while the AAII bears were at 60% for two months, this indicator only inched its way lower.
So, it is natural now to want to fade all the newfound bulls, considering we look all around us and it FEELS like everyone has turned bullish because the S&P has regained its mojo. It still feels too soon for me to have converted everyone. The indicators are not showing a lot of conversion yet. I expect we will see a larger shift in the next week or two. The indicators tend to move slower than the chatter (see above!)
Yet if you saw the Barron’s cover story this week, where they announced in their Big Money Poll that they had the most bears in 28 years (1997), and your immediate reaction is to be bullish because of that, I would ask you to dig a little deeper into the story.
If you read the story, you will see the poll was taken in late March, and they had a follow-up question the week after the tariff announcement. That means this poll is not current. It means this poll basically tells us what we already know: sentiment finally got panicky right after Liberation Day. I am only speculating, but I suspect had this poll been taken in the last week, the result would be very different.
In the short term, the market is very overbought. It really needs a pullback, especially now that it finally dug its way back to that resistance, I cited weeks ago at 5700 on the S&P. I still anticipate the intermediate-term indicators getting overbought just before Memorial Day. Thus, a pullback this week ought to lead to another rally.
And if you want to tie that into the sentiment discussion, just imagine how a pullback and another rally will change sentiment, just like the way that March rally that then went back down finally pulled the bulls to the bear camp.
New Ideas
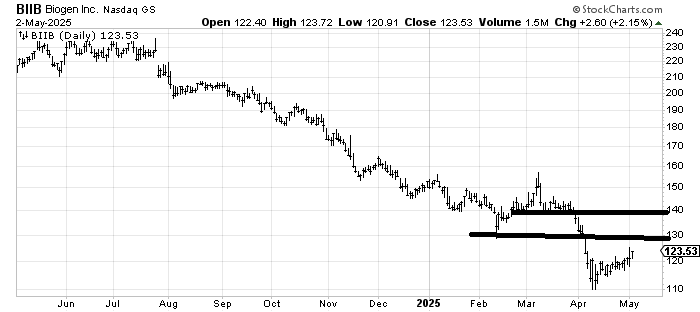
I’ve been asked if there are any of the biotech stocks I like. Over the years, we have had some good trades in Amgen, but I just haven’t seen much in that chart in months to get excited over. And all those small ones are so hard for me to keep up with. But if you are looking for a trade in a down-and-out stock that is in a downtrend, then perhaps Biogen BIIB is for you. It ought to make its way toward 130-ish. 140 might be a stretch, but a short-term trade to 130 seems doable.
Today’s Indicator
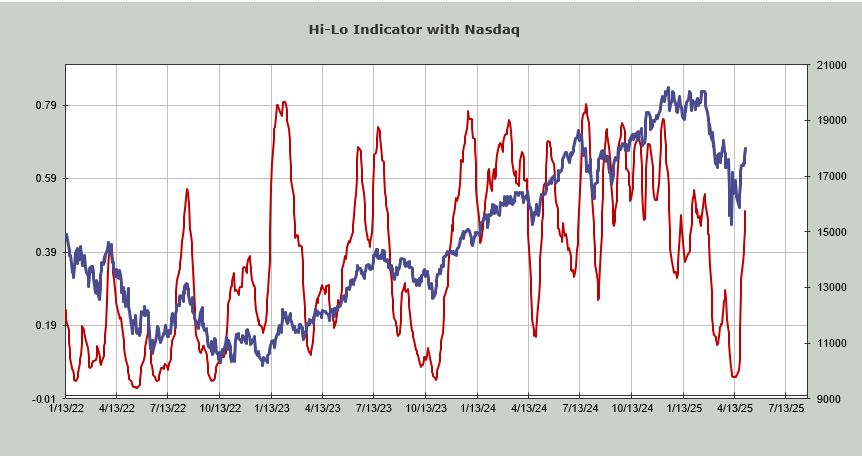
The Hi-Lo Indicator is at 0.50. I anticipate it will reach over 0.60 (overbought) in about another week. While the oversold condition in this indicator has a level, the overbought one doesn’t. Mostly, I look for the point in time that it rolls back over.
Q&A/Reader’s Feedback
Helene welcomes your questions about Top Stocks and her charting strategy and techniques. Please send an email directly to Helene with your questions. However, please remember that TheStreet.com Top Stocks is not intended to provide personalized investment advice. Email Helene here.
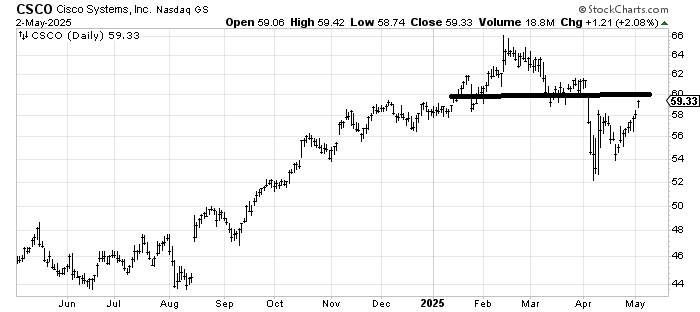
Cisco CSCO in the near term has resistance 60-62 that is going to be hard to overcome on the first push up there. If it gets over 60 and then pulls back I would view that more bullish than if it doesn’t. But as of right now, I would still expect those old highs to be resistance.
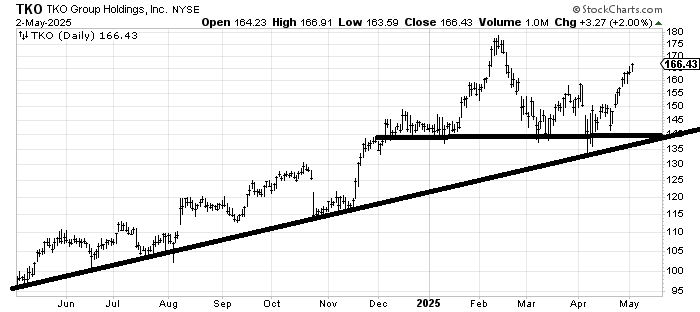
TKO TKO hasn’t done anything wrong, even in the first-quarter swoon. Right now, it’s over-extended, so a pullback is needed, but it ought to make a stab (after a pullback) at that old high. In many cases, those old highs are going to be tough to overcome. If market sentiment is giddy and the indicators are rolling over, I will view those old highs as big resistance rather than just short-term.
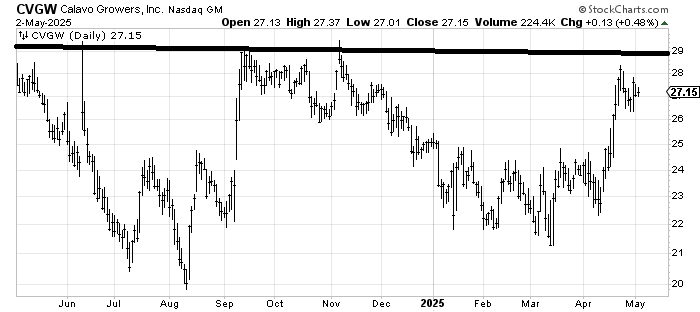
Calavo Growers CVGW is an interesting chart to me. Yes, it has resistance at 29 from those prior highs, but notice that it has done quite a bit of work in the last four or five months, forming a small base.
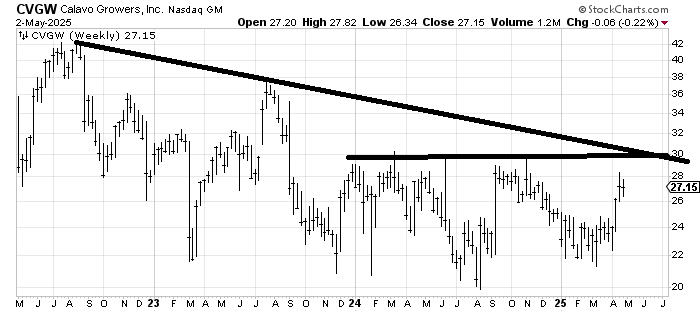
And when I look at the weekly, I see the stock has gone sideways (basing) for a year and a half. That would be a nice breakout over 30. If you have patience, this seems like it should do well longer term.
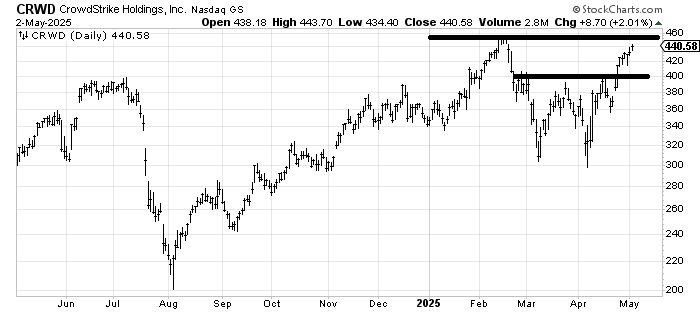
Crowdstrike CRWD, is another chart that is challenging the old high, just as we are short-term overbought. A pullback to 400 might be too much to ask, but if it pulled back there, I’d look for it to bounce from there.
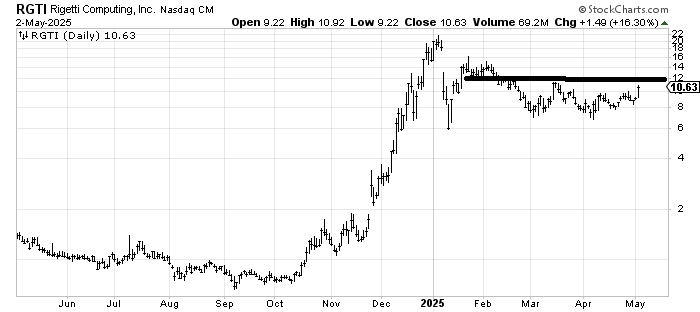
Our old friend Rigetti Computing RGTI has been basing since early March, so as long as it stays over 8 (I know that’s far away), it ought to do well. Resistance is at 12, but it has been chewing through it (see the mid-March rally).
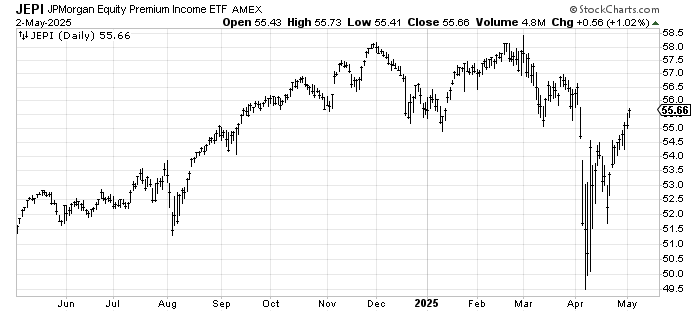
From a pure chart perspective, JP Morgan Equity Premium Income Fund JEPI looks over-extended and at resistance. It might push into resistance a bit more, but my guess is it sees a pullback and another push up. Then I’d re-assess it because I am inclined to be a seller if it does that.