Rates Creep Up Under Hawkish Fed Adding Downside Fuel to the Utes
The market was lower today, but the utility sector dropped below a key level.
You've reached your free article limit
You've read 0 of 1 free Pro articles.
The Market
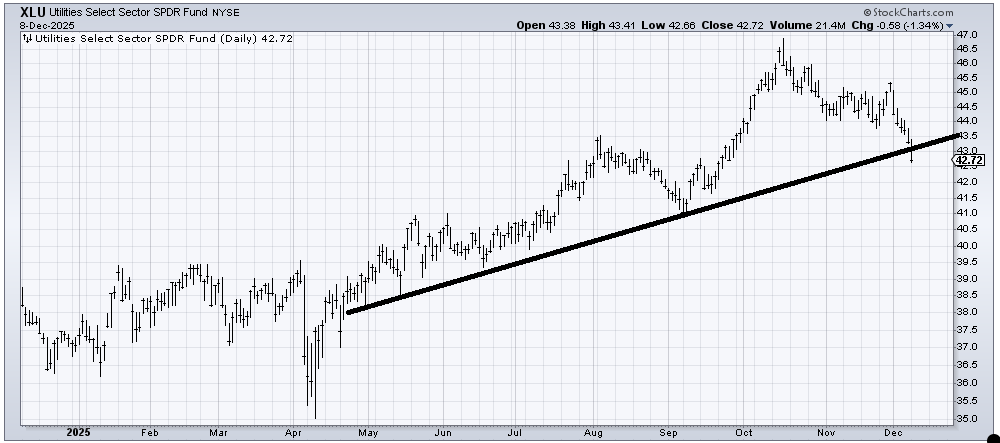
Now that wasn’t so bad, was it? Well, it was downright awful in the Utes. The Utes are back where they were in July.
Clearly, interest rates have a lot to do with that, but we don’t see other groups like the homebuilders making lower lows (not yet, at least). I can keep drawing in all sorts of lines, but no matter how we slide it, the Utes are down nearly 15% since October, and that is not bullish. They are, however, oversold, or will be in the next day or so. My only question is if they can recapture that 43 level.
Interest rates continued to creep up, and everyone has all sorts of reasons. The refrain today was that the market expects a ‘hawkish cut’ from the Fed. We had a hawkish cut in October, and the market wasn’t great after that. Here’s one difference: bonds rallied hard into the October meeting, and now bonds have come down a lot heading into the meeting. Thus, it is possible that bonds already expect it now where they did not expect it in October.
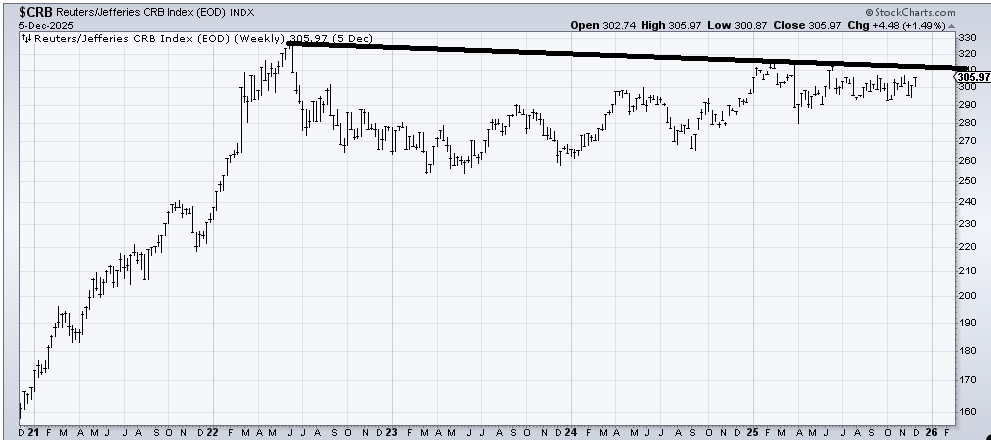
I would offer up one other chart that I expect we will start seeing passed around in the coming weeks/months: that of the Commodity Research Bureau Index (CRB). We looked at this months ago (this is a five-year weekly chart), but because it takes a long time to develop a weekly chart, I have not revisited it again. Should the CRB Index break out over that 310 area, that could be a problem for bonds.
In the meantime, today looked like a standard overbought pullback to me.
New Ideas
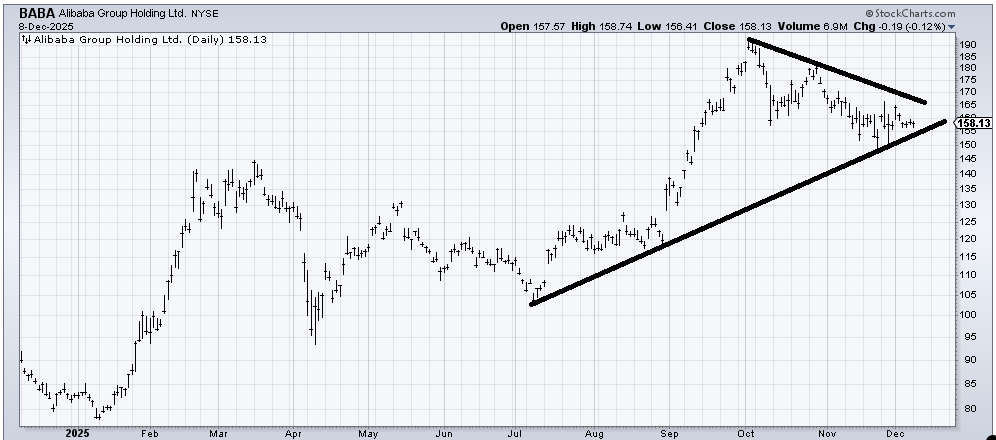
Now that Baidu (BIDU) has rallied so sharply, I was asked if I still think Alibaba (BABA) can rally. I do. It’s got to get itself up and over that 165 area, though. If it can do that, it can clear these two recent peaks and that downtrend line. I’ll be wrong if it breaks 150.
Today’s Indicator
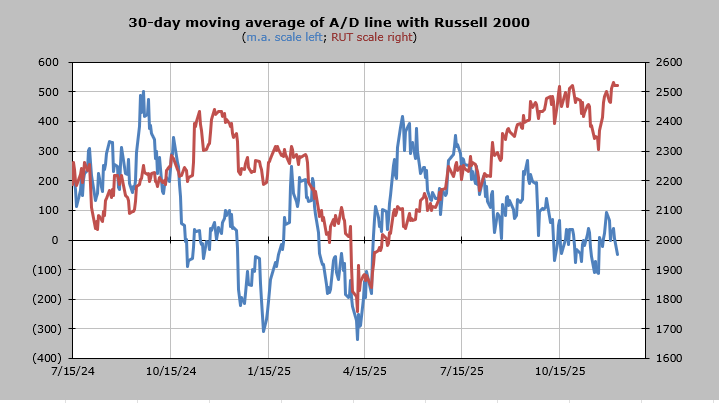
The 30-day moving average of the advance/decline line continues to hover around the zero line, unable to get to a decent oversold condition. However, now that it has fallen back under the zero line, I expect by the end of this week it will be heading back up over the zero line, just sloshing back and forth.
Q&A/Reader’s Feedback
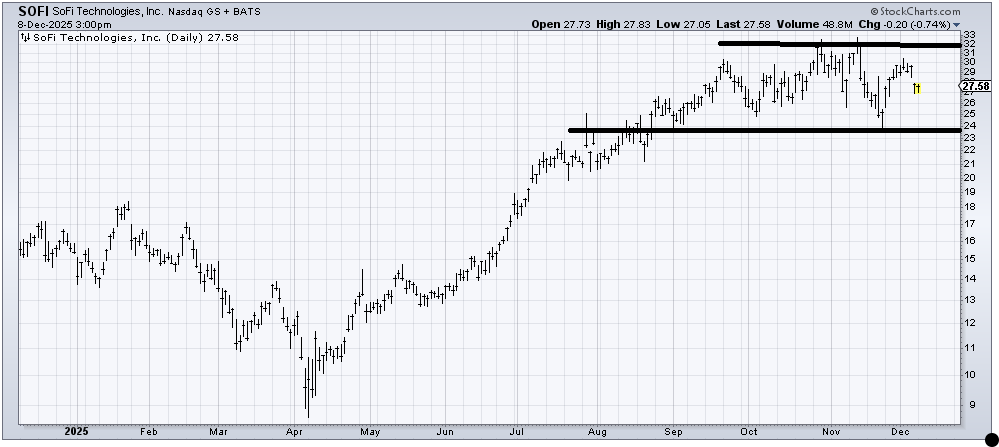
Let’s just say that SoFi (SOFI) hasn’t gone anywhere in months. Is this a consolidation or a top? Right now, we don’t know, so I’ll just say that it’s in a trading range. One thing that I would highlight is that financials (banks in particular) have done very well recently, and SOFI hasn’t done a thing.
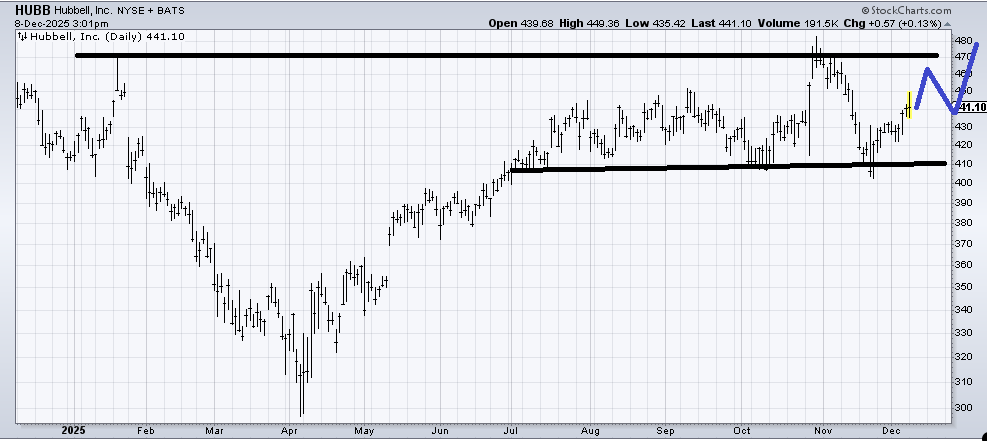
Hubbell (HUBB) is yet another stock that has mostly gone nowhere since July, with the exception of a few days in late October. If we want that to change toward a more positive view, then I’d like to map out something like I have drawn in blue. Otherwise, it seems to me the trading range carries on.
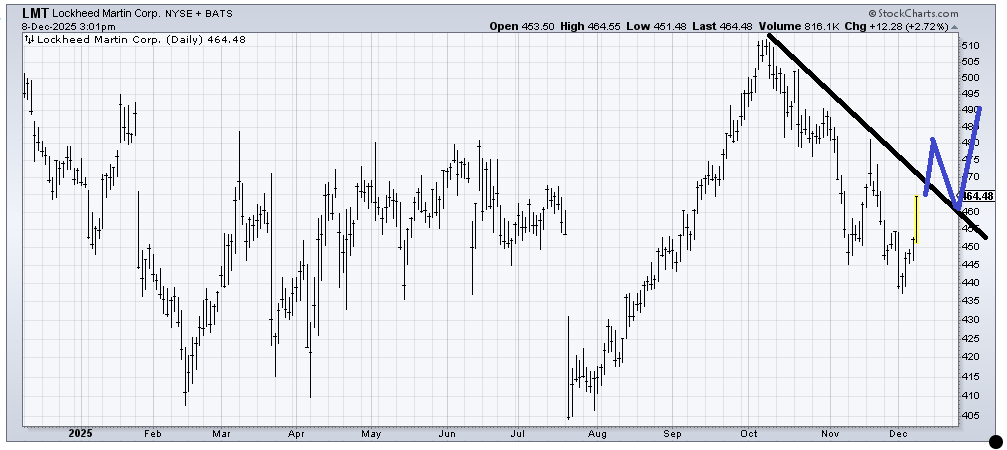
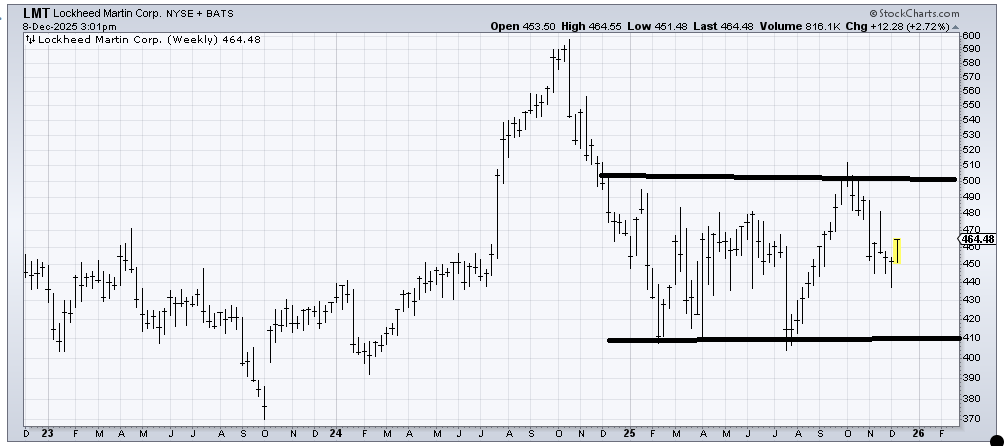
The daily chart of Lockheed Martin (LMT) has a lot of up and down, but in the end, the stock is flat on the year. I lean toward liking it, but let me move to the weekly chart to show you why.
The weekly chart (bottom) has a much wider range than it had in 2023-2024, but look at that big sideways that led to the giant rally in the second half of 2024. To me, it is somewhat similar. Back on the daily chart, I’ve drawn in what would get me excited about the pattern playing out.
Helene welcomes your questions about Top Stocks and her charting strategy and techniques. Please send an email directly to Helene with your questions. However, please remember that TheStreet.com Top Stocks is not intended to provide personalized investment advice. Email Helene here.
