I'm Raising My Rocket Lab Price Target to a Wall Street High
Here's my plan for the stock as I 'trade around a core position.'
You've reached your free article limit
You've read 0 of 1 free Pro articles.
Score one for the good guys.
Ten days ago, I published an emergency update for one of my core "Stocks Under $10" names, Rocket Lab USA RKLB. At the time the stock had been under pressure and was testing its 50-day simple moving average (SMA) from above. I said at that time that I was adding to my long position in case that line held as I believed that a Bull Flag pattern of trend continuance that I had drawn up for you would assert itself. That pattern looked like this:
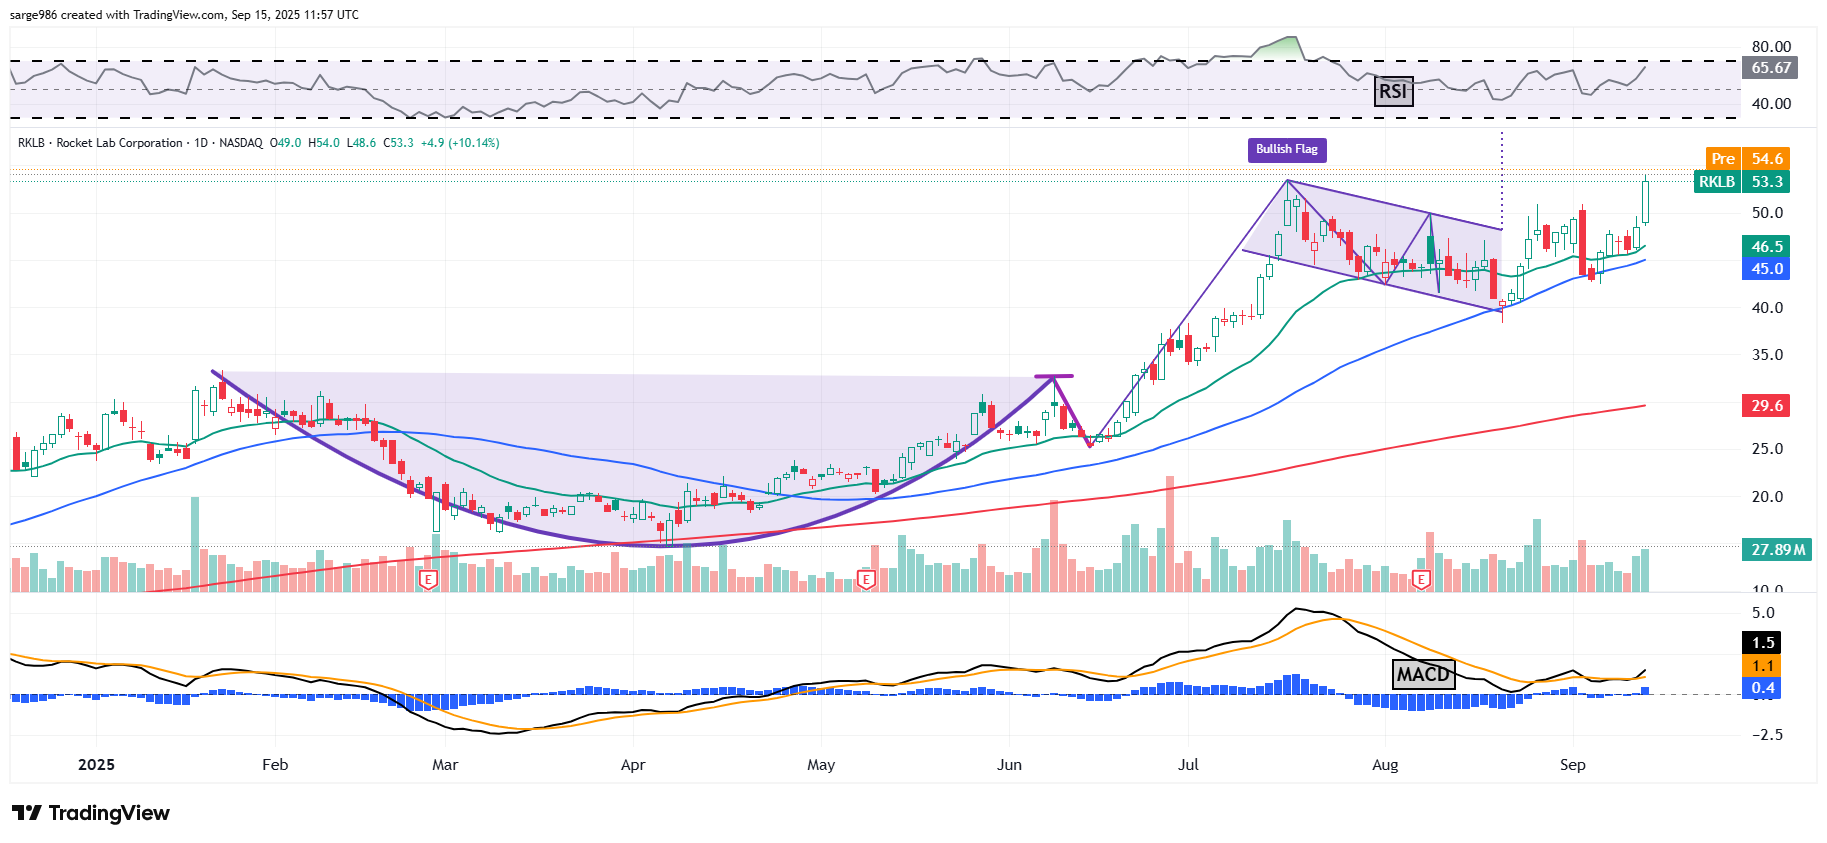
When I wrote that piece on September 5, RKLB was trading at $43.80. The stock is trading around $54.25 early Monday. That's about a 25% pop over ten days, which ain't half bad if you ask the old Irish guy from Queens, NY.
New Technicals
The stock surged off of that 50-day SMA, gaining acceleration from the swing crowd as it ripped through its 21-day exponential moving average (EMA). Readers will see above that the stock now bears a reading for Relative Strength that is quite robust, though not yet technically overbought. Readers will also see that within the daily MACD (moving average convergence divergence), the histogram of the 9-day EMA has moved above the zero-bound while the 12-day EMA has crossed back above the 26-day EMA.
These are all short to medium-term bullish indicators. Except for one thing. Take a look:
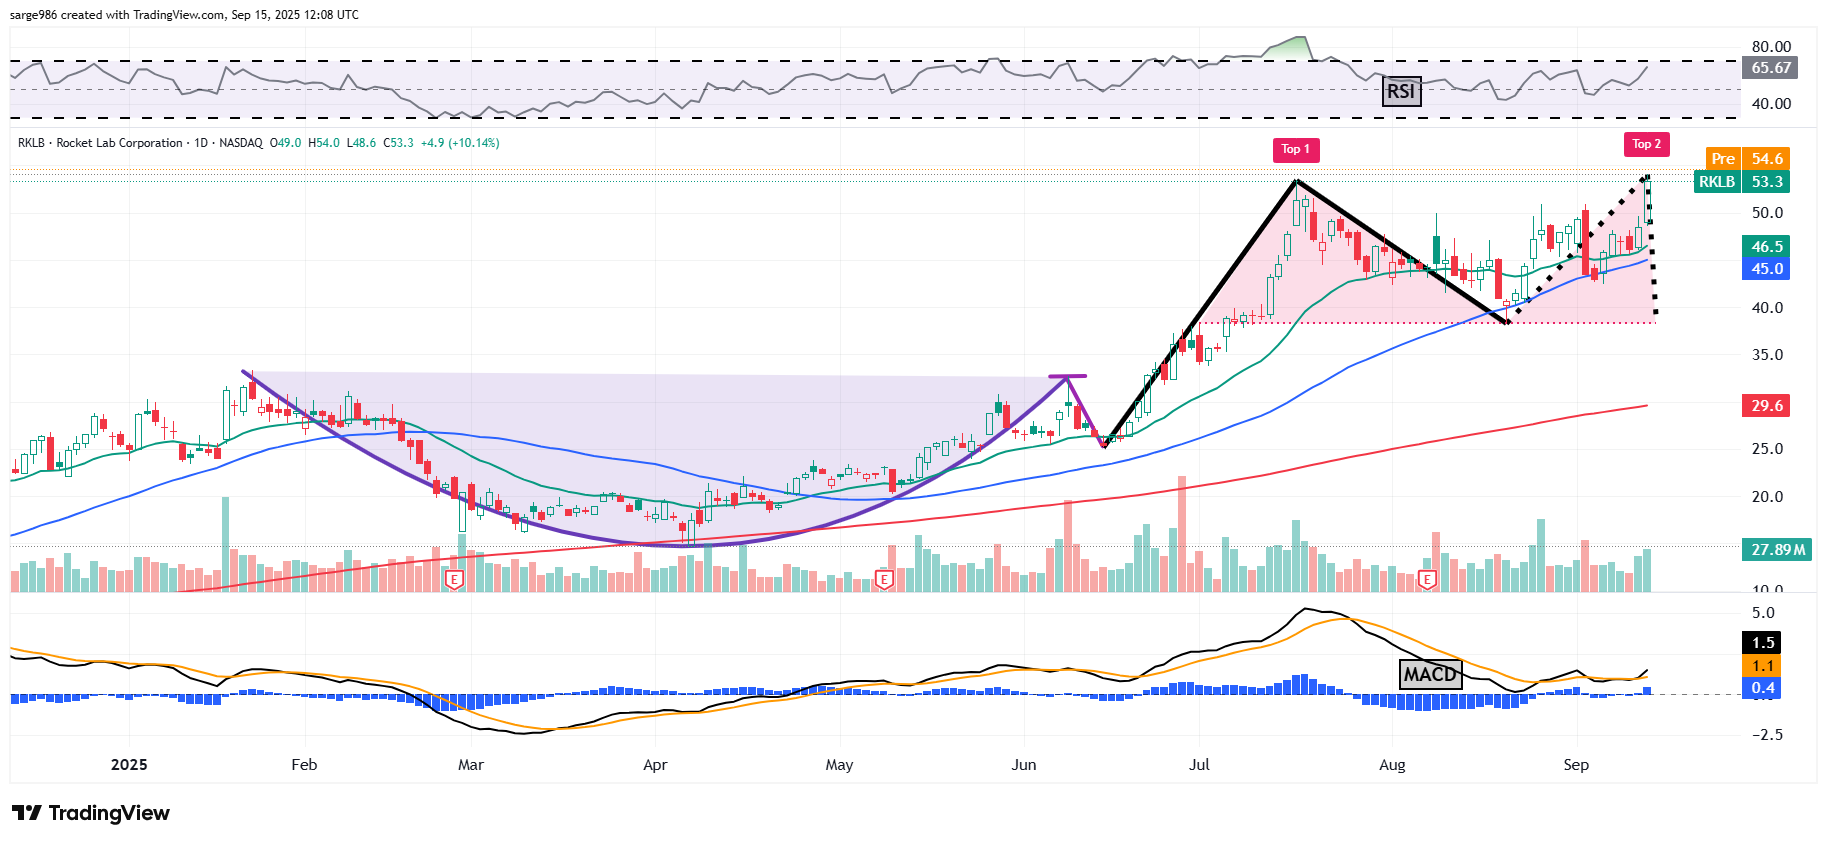
Not that the stock has to stop here, but readers need to be cognizant that RKLB is now at risk of potentially forming a Double Top pattern of bearish reversal.
What to do? Glad you asked.
The stock is not just up 25% since we added, it's also very likely to trade at my $55 price target that I had previously set for you. My plan is to take a profit Monday morning on the portion that I added on September 5.
For the new kids, that's called "trading around a core position" and it's something done frequently at the professional level. I will then adjust my target price and underlying levels.
Price Target: $63 (up from $55)
Pivot: $54 (crescent high), up from $48
Add: Down to the 50-day SMA (currently $45)
Panic: On loss of the 200-day SMA (currently $30)
Note 1: I believe this $63 target will again make me the high target on Wall Street.
Note 2: Should the Double Top prevail, the downside pivot would be all the way down at $38 and would involve the loss of said 50-day SMA.
At the time of publication, Guilfoyle was long RKLB equity.
