Put/Call Ratios Split: Stock Hedging Drops as ETF Protection Surges
Equity put/call slid fast as the rally started, but ETF hedging jumped—suggesting investors trust their names more than the broad tape.
You've reached your free article limit
You've read 0 of 1 free Pro articles.
 NYSE traders
The Market
I hate to make light of a very difficult world situation, and as of this writing, none of us has any idea how the deadline President Trump has imposed will turn out, although those Polymarket folks seem to always have an idea!
With that as a caveat, I am reminded of something the great Art Cashin (a NYSE Floor Trader) once said: never bet on the end of the world because there will be no one left to pay you.
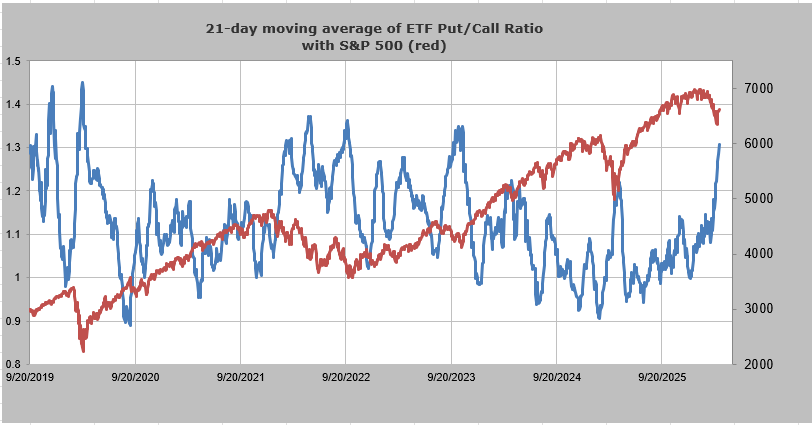
So today I am going to go back to the options ratios once again. Before the rally began, I highlighted the 21-day moving average of the put/call ratio for ETFs. At the time, it had just surpassed the April 2025 high and was approaching the high from the fall of 2023. It is now bumping up against the 2023 area. But more than that, you can see the skyrocketing it has done in the last few weeks: from just under 1.1 to 1.3.
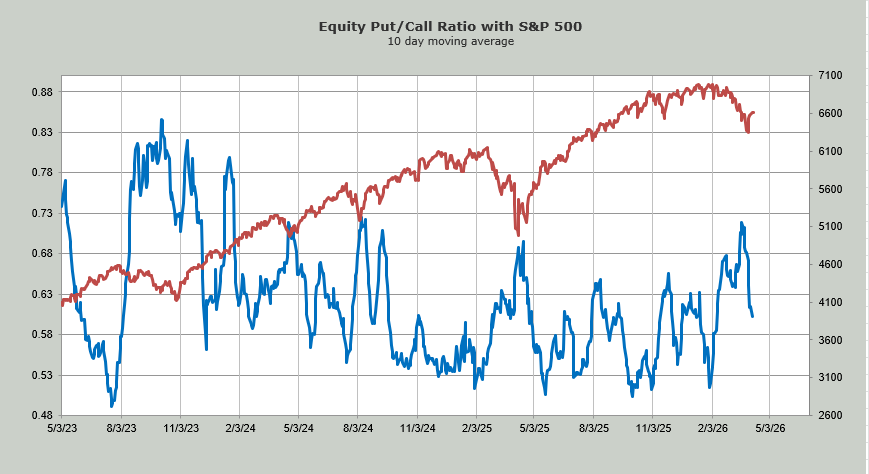
Now take a look at another chart we looked at before the rally began: the put/call ratio for equities only. It too has surpassed the April 2025 level and actually got up to that fall of 2024 level before heading south.
And that is what I want to highlight today: that tumble downward since the rally began. It has gone from just shy of .73 to .60. That is quite a tumble in five days.
It has been my contention that for several weeks now, folks have been hedged up, and these put/call ratios show it. But what these two show me is that folks are no longer hedged up in individual stocks, but they continue to be hedged up in ETFs. It’s the old, I like my stocks, but I don’t like the indexes (or something like that).
In any event, the S&P, Nasdaq, and the Russell have now been green for five straight days. This is the longest ‘up’ stretch for any of these since late January. The Russell last went more than five up days in early October, which is the same for the S&P.
As long-time readers know, the longer these streaks go on, the more likely it is the market will see a down day (or more). But as I said yesterday, I think we can see some shaking around and an increase in volatility, but then I think we’d see a rally again. So far, this rally has been quite lethargic.
New Ideas
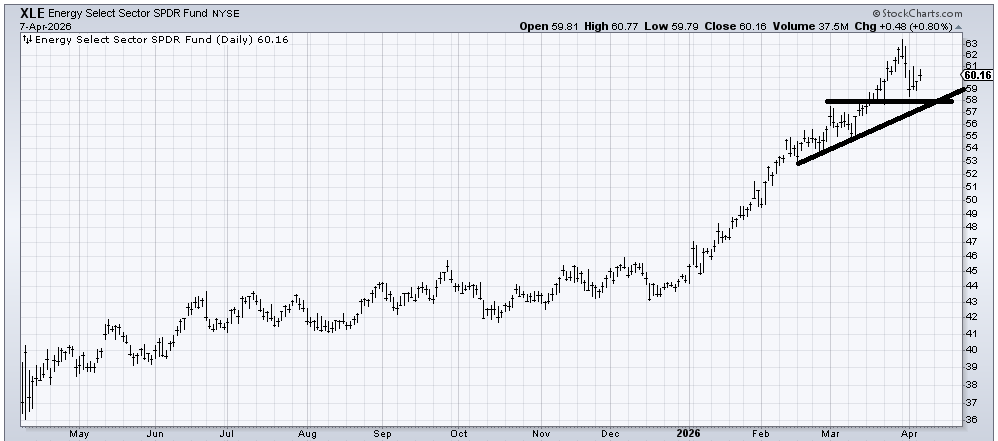
For the first time in quite some time, I can draw a line on the chart of (XLE) . In fact, I can draw two lines. I have not been a fan of XLE for several weeks now, so I want to show you the level that if you are bullish on XLE, you want it to hold: 57-58-ish. Breaking that wouldn’t be awful, but it would be the first sign of a crack.
Today’s Indicator
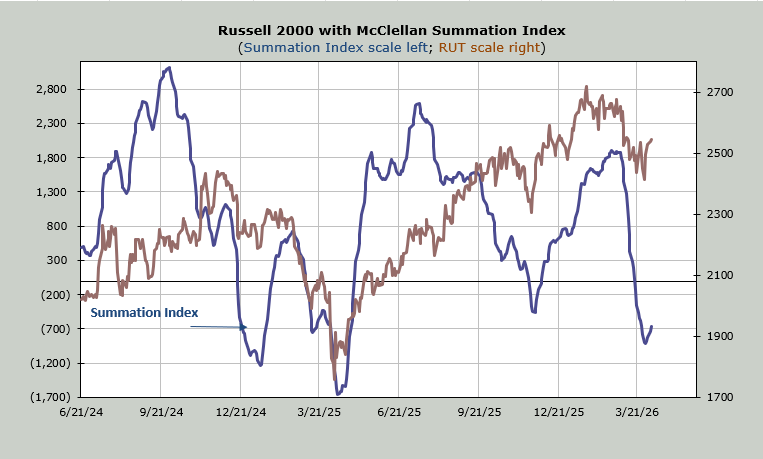
The McCellan Summation Index is heading up. It will take a net differential of -1400 advancers minus decliners to halt the upward push. That’s not a big cushion.
Q&A/Reader’s Feedback
Helene welcomes your questions about Top Stocks and her charting strategy and techniques. Please send an email directly to Helene with your questions. However, please remember that TheStreet.com Top Stocks is not intended to provide personalized investment advice. Email Helene here.
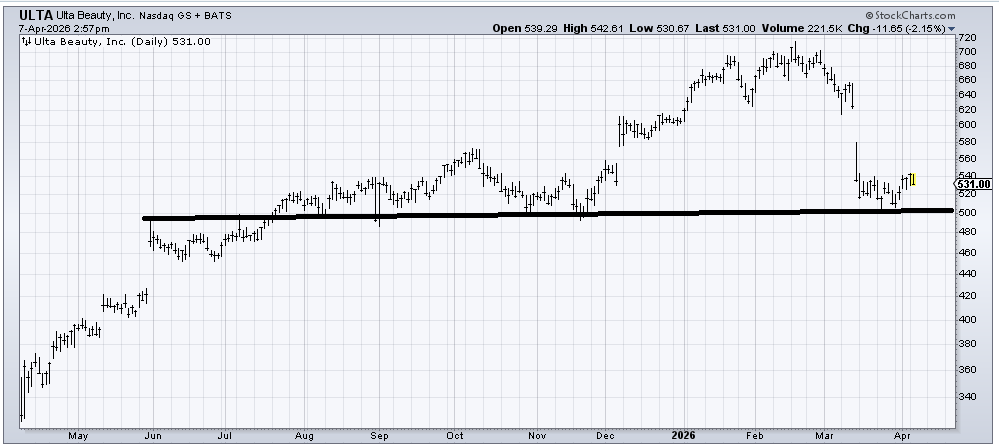
Ulta Beauty (ULTA) left an island overhead when it gapped down in March. But it fell right to support. My guess is dips, especially if they get into the 500 area, will get bought for the time being. A serious break of 300 would confirm the top that seems to be building.
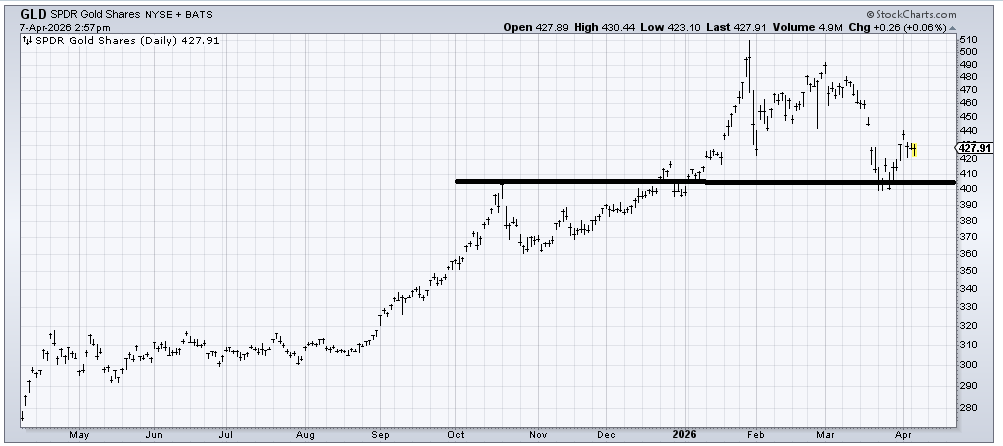
(GLD) got oversold when it got near 400, and I said I thought it was oversold enough, and the DSI was at 15, so it should rally. It rallied, but all it did was come close to closing the gap at 440. I would like to see GLD come back down and form a W pattern to confirm to me that the 400 area is good support.
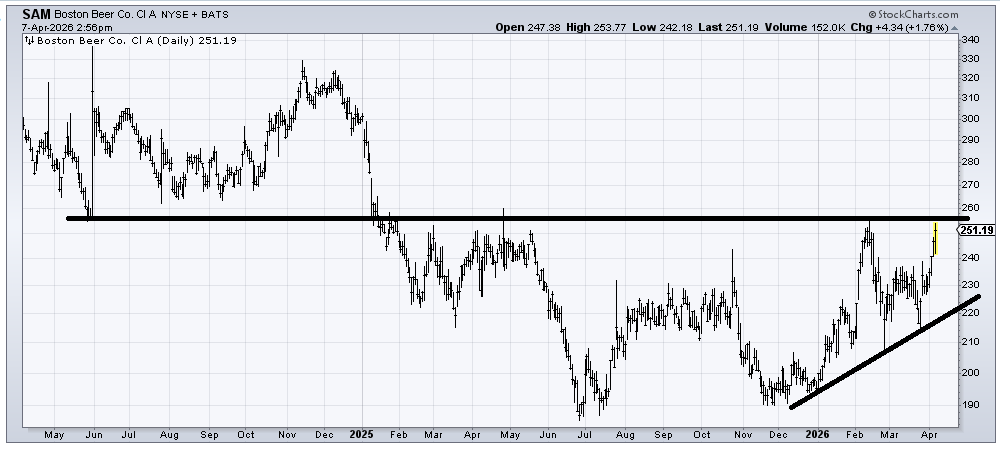
Boston Beer (SAM) looks like it is forming a base. Short term, it is a bit over-extended, but the longer-term view is that it is a base that ought to eventually break out. A trade back under that uptrend line would be bearish.
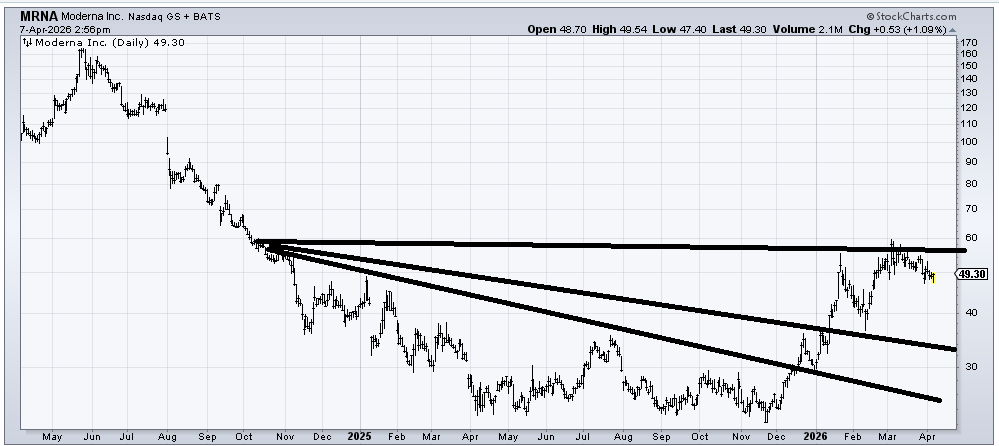
Moderna (MRNA) looks a bit tenuous in the near term, especially if it breaks 46-47. I would like to see it spend some time holding in this mid 40s area for a few weeks to gather enough steam to break out over 60. If it breaks that mid 40s area, I would like to look at it again because it won’t nix the chart, but that 60 area is pretty serious resistance.
Related: As Iran Conflict Weights on Markets, the Korean Defense Sector Is Thriving
