Put/Call Ratio Drops; Watch the Short-Term Oscillator Thursday
You know what changed today? Sentiment.
You've reached your free article limit
You've read 0 of 1 free Pro articles.
The Market
Note: I am taking Thursday off. The next edition of Top Stocks will be this weekend.
You know what changed today? Sentiment.
Recall two days ago I told the story of the strategist who all of a sudden had turned cautious based on the percentage of stocks trading above their 50 day moving averages. Yesterday I continued to see caution, not just in the anecdotal chatter but in the put/call ratio. The put/call ratio was .95 after Tuesday’s trading.
On Wednesday the chatter was all gushing over the "others" (and it was an Either/Or Market today). I mean there was so much gushing. I think I saw only one person who said he was bullish but to stick with the big caps. So he wasn’t bearish but he was not a small-cap, or "others," fan.
Then came the put/call ratio. Today it was .74. Acceptance. It’s not extreme but it is the lowest since July 18, which was about three trading days before the Russell made that high around 225 IWM and swooned 4%.
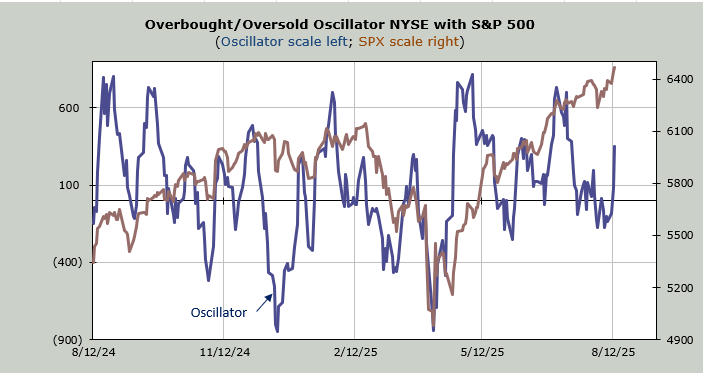
The short-term Oscillator will get overbought again Friday.
The DSI did not change, which is no surprise since the VIX barely budged and the S&P and Nasdaq spent the day in fluctuation. And the stocks that have been hot were not. There is no DSI reading for the Russell, so we are left to guess there.
One final note on the DSI. I forgot to note that after Tuesday’s trading it was 82. That’s not extreme but rather is knocking on the door to extreme.
New Ideas
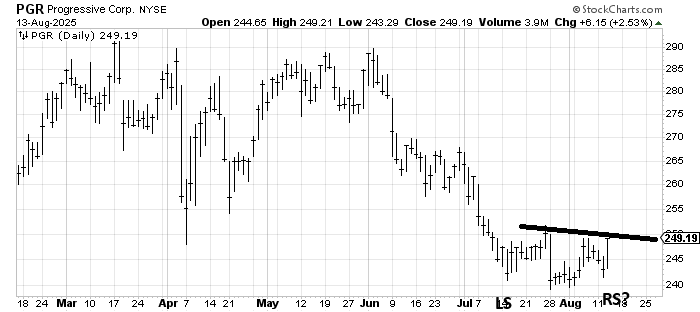
Just a reminder that Progressive Insurance PGR is a name I recommended a few days ago and it is knocking on the door of that neckline of the head and shoulders bottom I drew in.
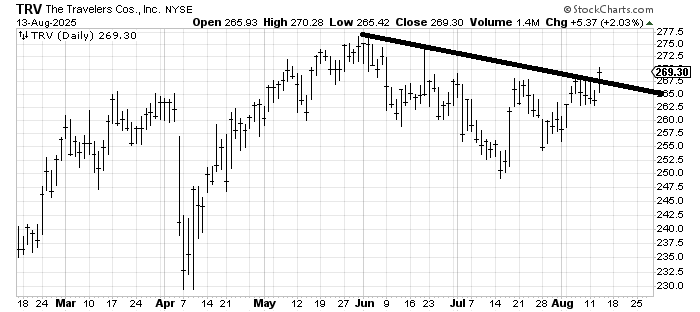
Travelers (from last week) TRV crossed the downtrend line.
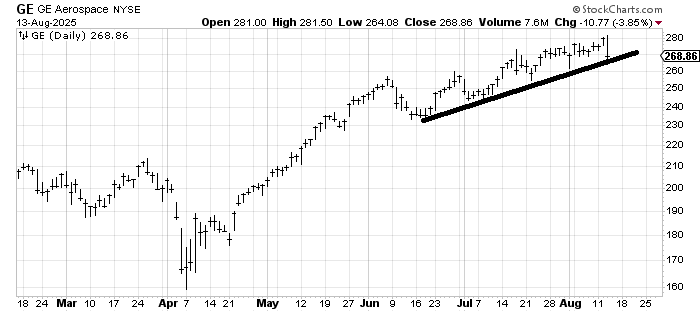
In the Either/Or category we have GE Aerospace GE, which got sold today. It has bounced off this line on every touch since June. Let’s see if there is any follow through this week. Does it break?
Today’s Indicator
Today’s Indicator
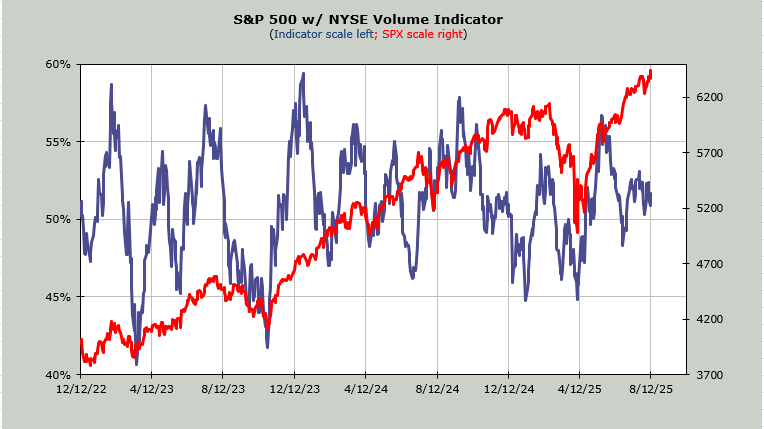
The Volume Indicator hasn’t budged in weeks. It is still 52%, which leans overbought.
Q&A/Reader’s Feedback
Helene welcomes your questions about Top Stocks and her charting strategy and techniques. Please send an email directly to Helene with your questions. However, please remember that TheStreet.com Top Stocks is not intended to provide personalized investment advice. Email Helene here.
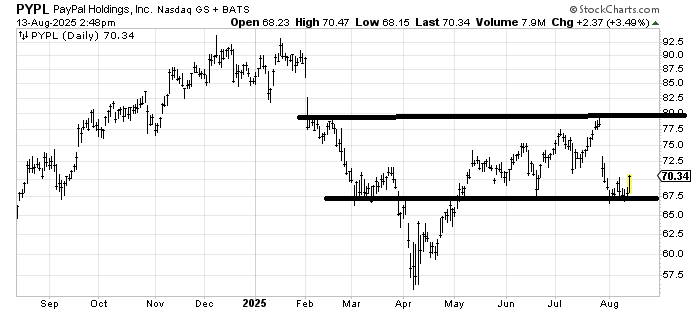
I don’t love the chart of PayPal PYPL because of that gap down in late July but it can/should try and fill that gap before we get overbought.
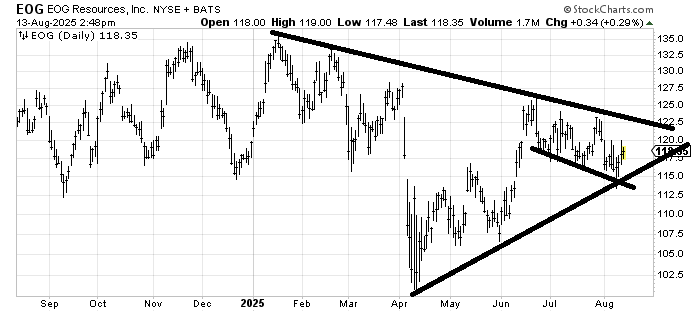
The question is whether I still think EOG EOG can cross that downtrend line. I do. But so far it is doing its best to prove me wrong.
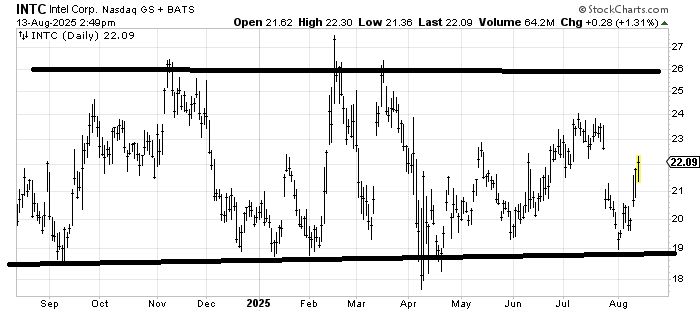
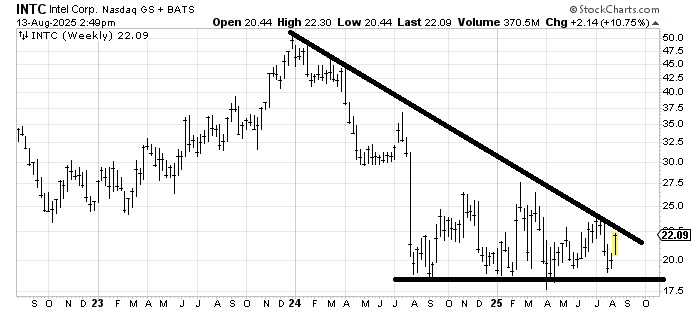
I look at the one-year chart of Intel INTC and I see the same chart we’ve seen for a year: sideways. When I look at the three-year weekly chart I also see the big sideways, but now I can draw a long-term downtrend line that if crossed would be a great first step toward completing what seems to be a developing base.