Persistent Selling Without Panic
Let's dive into the sentiment, volume, momentum, and breadth charts.
You've reached your free article limit
You've read 0 of 1 free Pro articles.
The Market
The market has been short-term oversold for almost three weeks now. It’s barely been able to lift itself up off the mat. It has mostly churned since getting oversold.
Conventional wisdom says that a market that can’t rally when oversold is bearish. Conversely, a market that can’t sell off when overbought is bullish. But it’s not just an oversold condition we have this time.
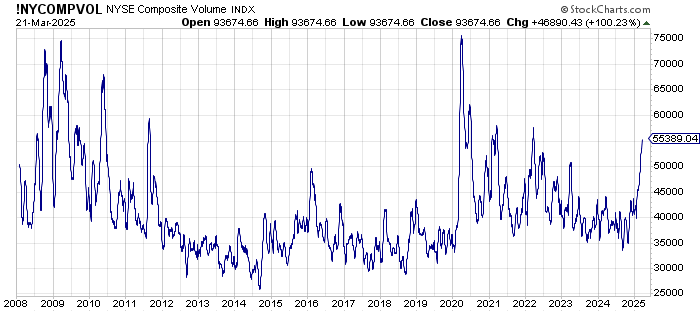
We have sentiment bearish, although never panicky. We have a lot of selling over the last several weeks. We can tell when we look at the 20-day moving average of the NYSE volume. It has soared. Not only is that rare for markets that are rallying, but it might also explain why the oversold condition has gotten no traction: sellers meet every rally.
If we consider all those other previous surges in volume, we understand they tended to arrive amid panic. Yet not this time. This time it is much more persistence without the panic. So yes, something has changed.
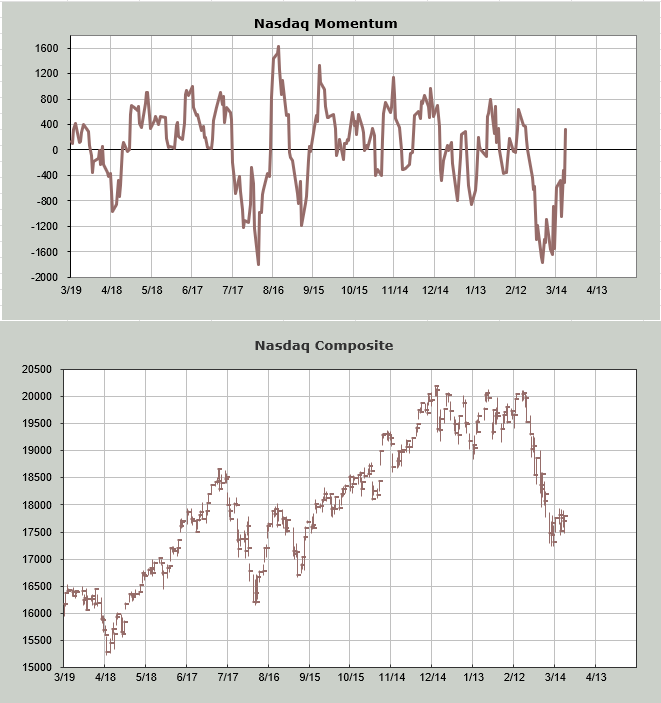
Something else that has changed is the Nasdaq Momentum Indicator. Recall it got oversold just over two weeks ago. This chart will show you how much Nasdaq tends to rally when we get not only such an oversold condition but also once that indicator moves up price flies along with it. Yet here it is already over the zero line and price has barely budged.
Yet the number of stocks making new lows has not expanded, despite all the selling. Breadth has not made a lower low, despite all the selling. And sentiment has not changed much in two weeks.
V bottoms tend to come amidst panic. We’ve already ascertained there has been no panic, just persistent selling. Could it be that there is this date circled on the calendar for a tariff announcement (April 2nd) which makes the market locked in beforehand? And will we have some repositioning going on this week because we are heading into the end of the quarter?
This is why I like to mute the news and just stare at the indicators and stats. Here’s my best guess: if the market sells off—oh maybe not Monday or Tuesday—but later in the week, as we get closer to the deadline date and breadth is mostly negative into the end of the quarter, we would be set up for a relief rally post the now circled date of April 2nd.
No matter how it turns out, I do think something has changed in the market in 2025, mostly for me it is the lack of panic coupled with the persistent selling. Persistence not panic.
New Ideas
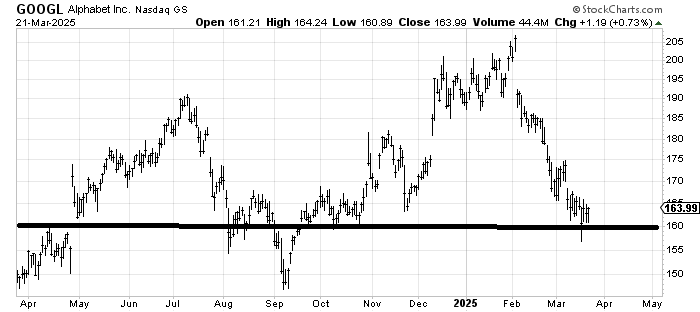
I was asked if I still have a positive bias toward Alphabet GOOGL despite it milling around the proving me wrong. I do. It just has a decent amount of support down here that I feel it should rally at some point.
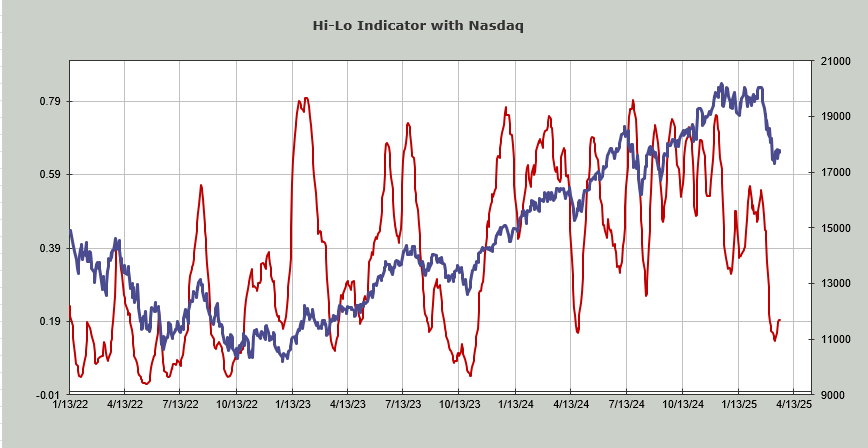
Today’s Indicator
The Nasdaq Hi-Lo Indicator is still in oversold territory. In the spring of 2022 it stayed down there for quite some time. The NYSE did not get oversold.
Q&A/Reader’s Feedback
Helene welcomes your questions about Top Stocks and her charting strategy and techniques. Please send an email directly to Helene with your questions. However, please remember that TheStreet.com Top Stocks is not intended to provide personalized investment advice. Email Helene here.
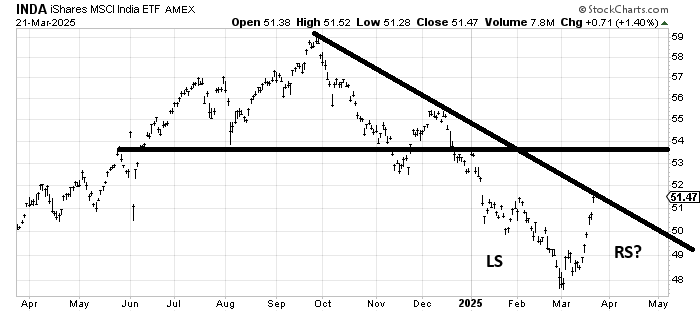
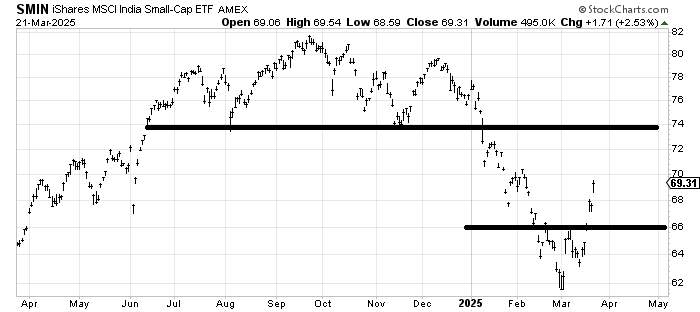
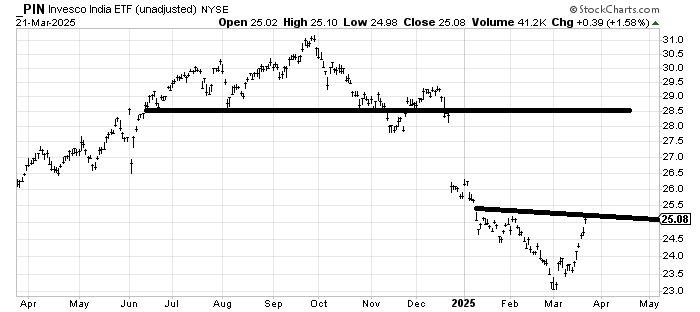
I was asked to revisit the three India charts again. They have all rallied strongly (now that is what an oversold rally looks like!) but they all broke down from big tops so there are no bases, just stocks attempting to form them.
There is still no base to speak of. But the iShares MSCA India ETF INDA did met its measured target in early March. If it can pullback toward that 50 area it might start to show us a head and shoulders bottom.
The iShares MSCI India Small Cap ETF SMIN more than met its downside target but it’s the same pattern and my guess is if it makes it to 74 that is doing to be some heavy resistance. There is light support at 66-ish.
The Invesco India ETF PIN is a similar pattern only it hasn’t done nearly as well in its oversold rally. Again, a pullback toward 24.50 ought to give it a head and shoulders bottom look.
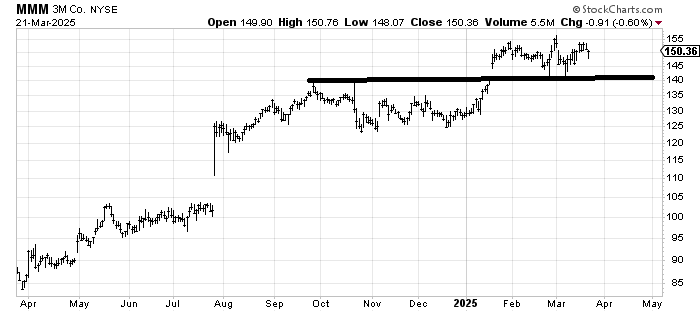
3M MMM has held up so well in 2025. It’s downright impressive. But it met its measured target at 155 and now has been consolidating. If it can get over 155 the next measured target would be around 170. I would use a stop under 140. I often do not trust a stock that has had no selling while the entire market has to rally well thereafter which is why I would respect that stop under 140.
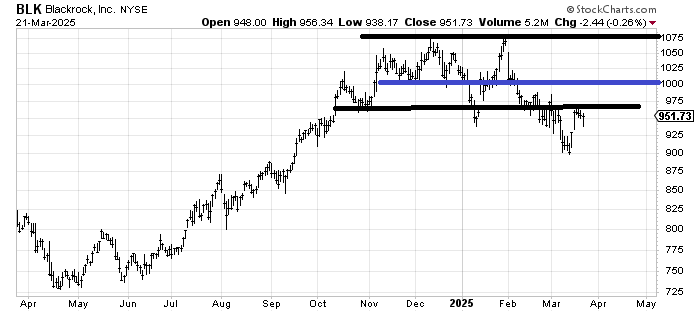
Blackrock BLK is one of those stocks that seems to enjoy shakeouts in both directions. The break under 975 in January shook it out but so did that massive run back to the top at 1075. There is a lot of resistance at 1000-ish so it probably won’t respect that either! My inclination is that if it gets there I’d be leaning toward selling, depending on where the market was at the time.
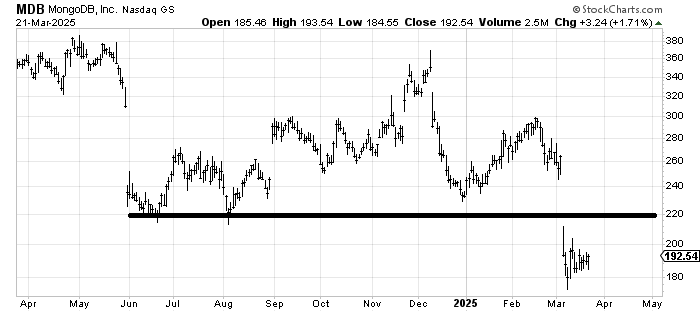
There are far too many charts that look like MongoDB MDB: gapped down, stabilized, oversold enough to rally but that’s all I see is an oversold rally. If it can rally to close that gap in the 220-230 area I’d be a seller.
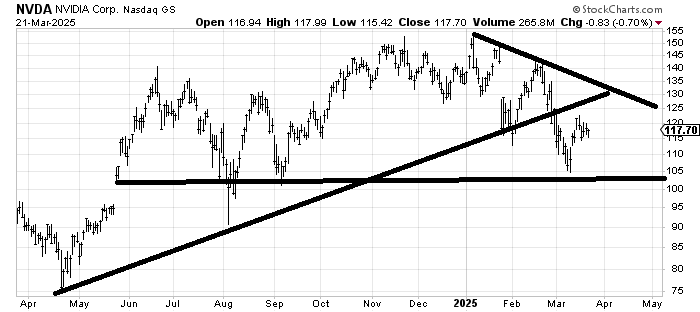
In the big picture NVIDIA NVDA still looks like one giant sideways and a potential top. If the chart can rally to that 130-135 area I’d be a seller.