Oversold Yes, or Not So Fast?
While one of my indicators says "yes," others are telling us that more downside could be ahead.
You've reached your free article limit
You've read 0 of 1 free Pro articles.
 Staying Patient but Looking for Oversold Stocks
The Market
There are a few charts to highlight this week, but I don’t have any that show overall market panic with positive divergences.
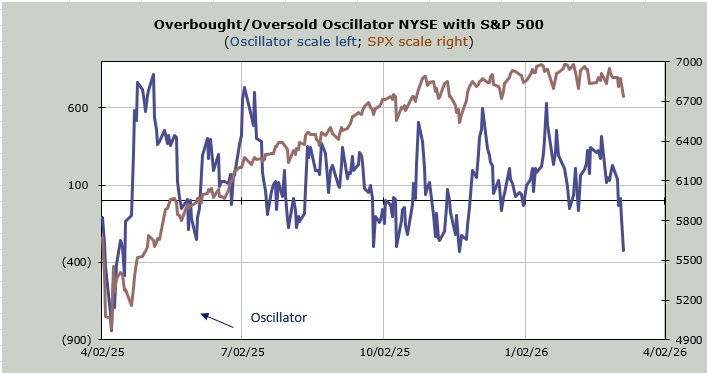
Let’s begin with what will surely be chatted up this week: are we oversold? The chart of my Overbought/Oversold Oscillator screams yes, the math behind it though, says not so fast. The chart screams yes because here it is back where it was in November at the low. But keep in mind this is the ten-day moving average of the net of the advance/decline line.
Back in November as we headed into that low, we looked back to see that heading into that week we had a few more positive numbers to drop and then we had a string of negative numbers to drop. A long string of negative numbers to drop means we are oversold. Now I look back and see that a mere five of the last ten days had negative breadth, and at that only two consecutive days: Thursday and Friday. Keep in mind the selling began in late October then, so we were three weeks into it, now we are one week into it.
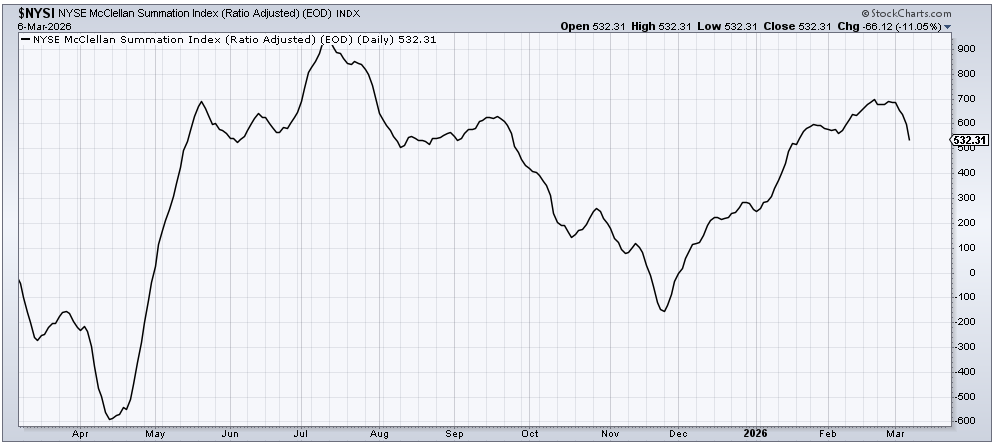
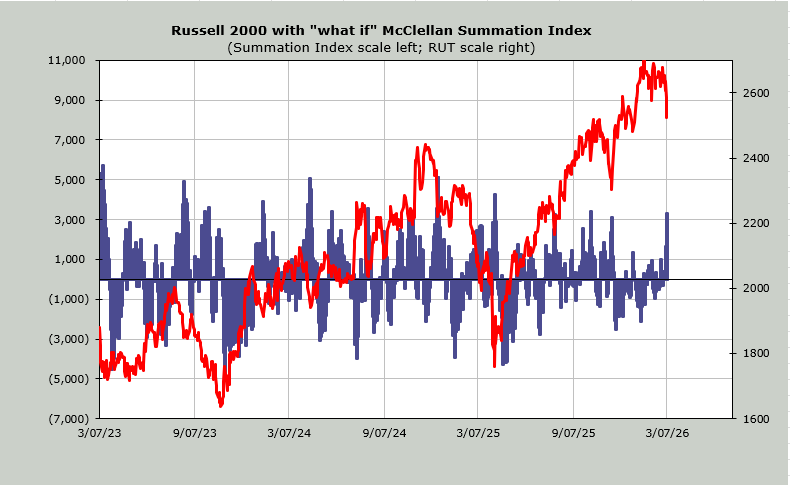
But wait, there’s more. The McClellan Summation Index is now heading south, having just turned down last week. Notice how in November it had been heading south since July. Yet it will not require a net differential of +3300 advancers minus decliners on the NYSE to halt the decline. Over +4000 and we’ve stepped a toe into oversold territory.
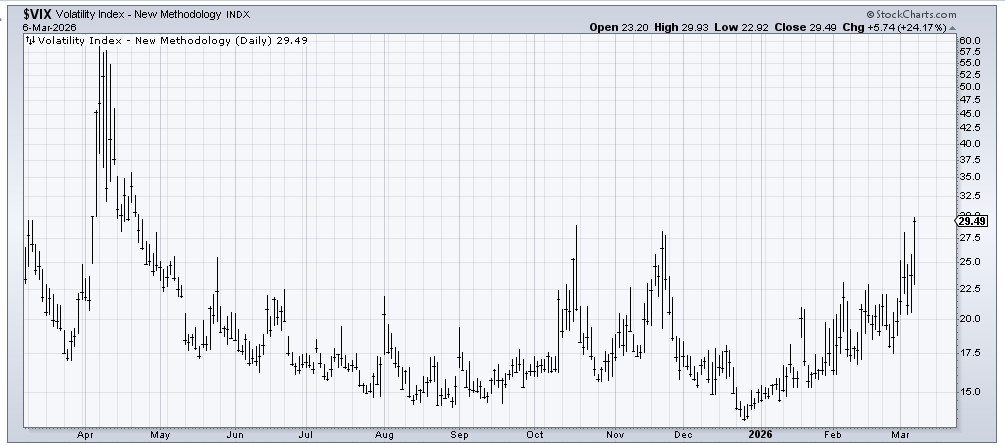
And look at the VIX, it is sitting there, on the verge of doing what I have wanted it to do so often in 2026: get jumpy.
Then there is sentiment. None of the indicators changed much in the last few days. Shockingly we didn’t even see the put/call ratios spike on Friday (bothersome in my view). But anecdotally, those who were very complacent and casual early in the week had definitely become cautious and concerned by Friday afternoon. It often begins with chatter and then it shows up in the indicators. For example, last week the Investors Intelligence bulls were still 52.7% and the bears were 14.6%. I would be shocked if we don’t see the bulls in the 40s and the bears much closer to 20% this coming week.
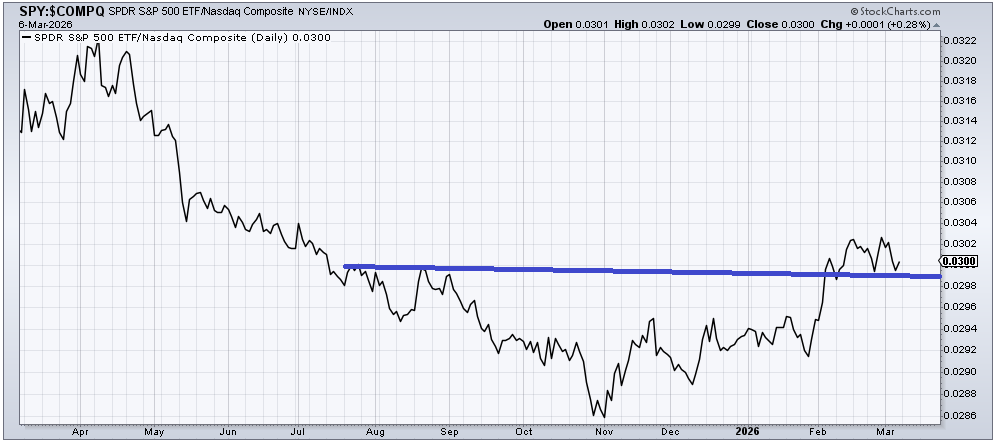
The next chart is the S&P relative to Nasdaq. I have discussed this chart much this year but in recent weeks have not discussed it. That’s because it stalled out. I am waiting for it to break back down or breakout. For now it continues to consolidate. Should it break that blue line I would have to re-assess but for now even the rally in tech last week has not broken this down (I still think tech should outperform the 493, as I have for a few weeks now). As a reminder, to use a phrase I hate but everyone seems to love, up tends to mean ‘risk off’ while down tends to mean ‘risk on’.
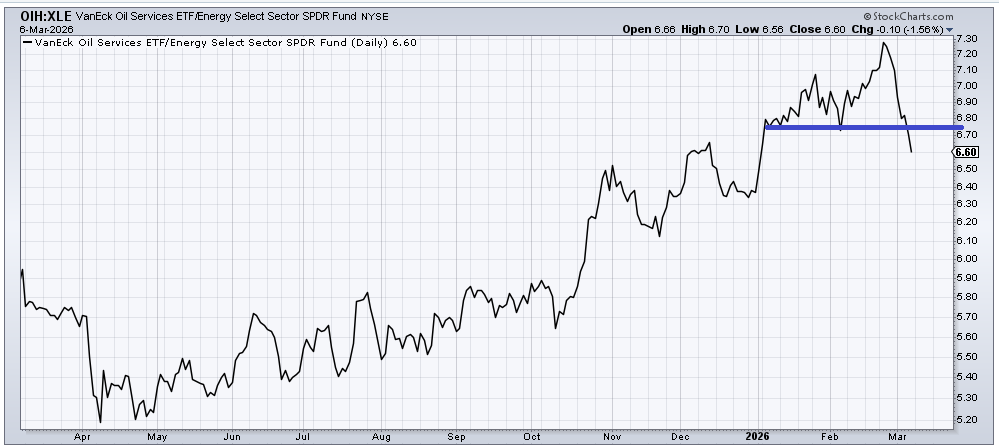
One ratio chart that has changed drastically is the OIH to XLE. Long-time readers will know that my view is when this is rising it tends to be bullish for oil stocks. OIH is higher beta (this is the same concept as the S&P to Nasdaq chart above) than XLE, so up means folks are enjoying the ride and taking on risk. Down means they are pulling in their horns. This turned down over a week ago, and it broke the prior ‘support’ levels.
I advocated selling energy stocks a few weeks ago, and I still think that is the way to go for now, especially based on this chart. There will be oversold rallies, but it seems to me we’ve gotten the most out of energy stocks for now.
New Ideas
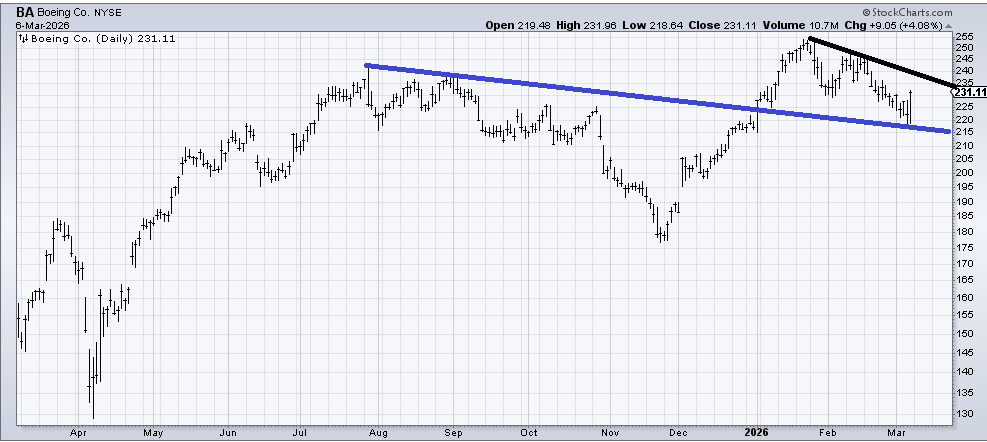
I advocated buying Boeing (BA) early last week as it was coming into support. In a sea of red, it was one of the few positive stocks on Friday that wasn’t tech or staples. That doesn’t mean we can rest easy. We do not want to see it trade under that blue line.
Today’s Indicator
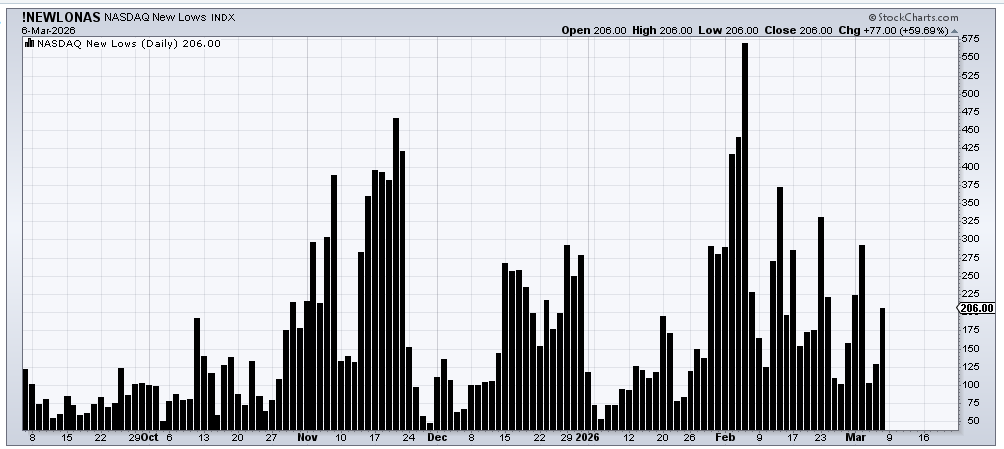
The number of stocks making new lows on Nasdaq (and the NYSE) is still fewer than their peak readings of a few weeks ago. If we can get a proper oversold condition with some proper negative sentiment and there are fewer new lows at the time, I would consider that bullish.
Q&A/Reader’s Feedback
Helene welcomes your questions about Top Stocks and her charting strategy and techniques. Please send an email directly to Helene with your questions. However, please remember that TheStreet.com Top Stocks is not intended to provide personalized investment advice. Email Helene here.
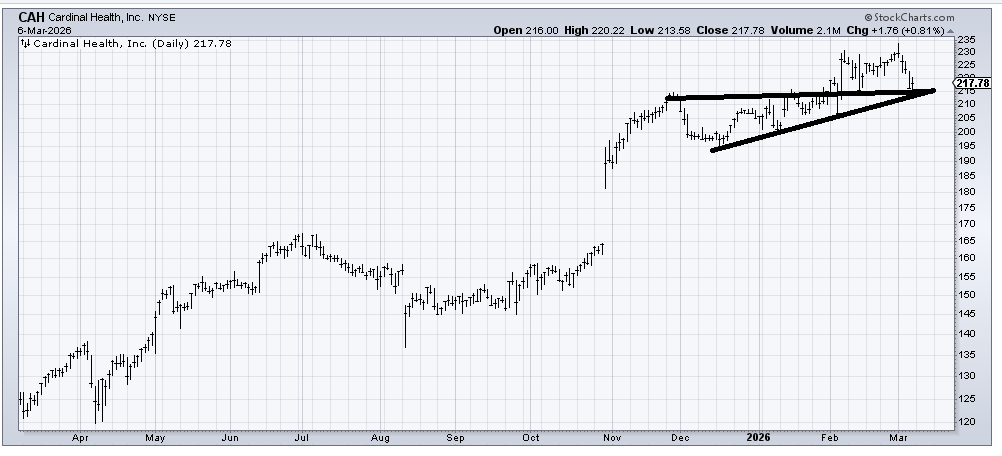
While Cardinal Health (CAH) is not my kind of chart (up too much), it hasn’t done anything wrong yet. Should it break that 210 area, I would get concerned.
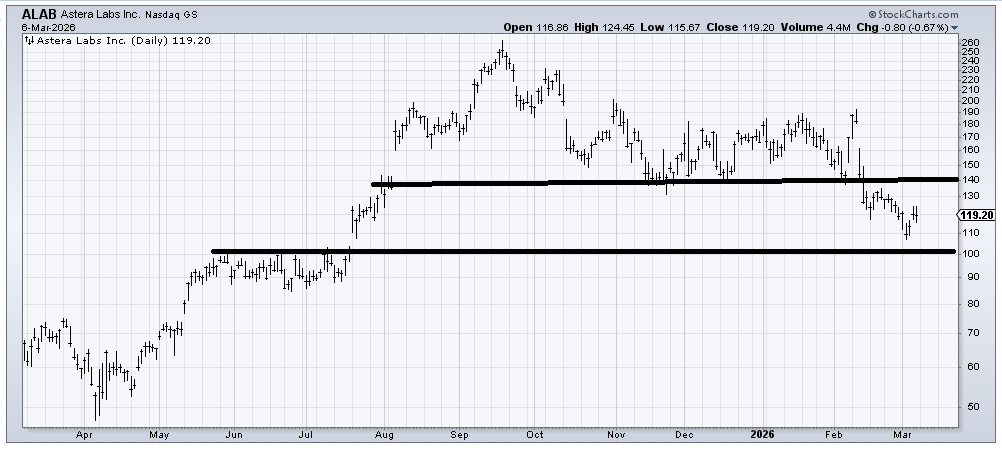
I would not be surprised if Astera Labs (ALAB) rallies back to that 135-140 area, but mostly for now, I would say it’s in a range between 100 and 140-ish.
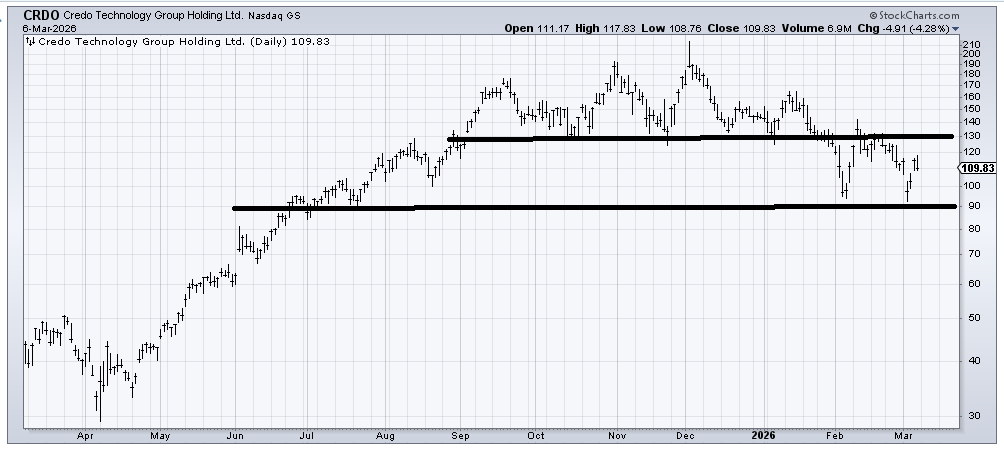
Am I the only one who sees the ticker for Credo Technology (CRDO) and thinks ‘crudo’?! I want to like that double bottom (at 90-ish), but I also see the resistance at 130-140. So here too, I’m going to call it a trading range for now (90-130). It didn’t have the kind of massive sell-off so many other tech stocks did, so it still feels somewhat incomplete. (i.e., it did not revisit the April 2025 low)
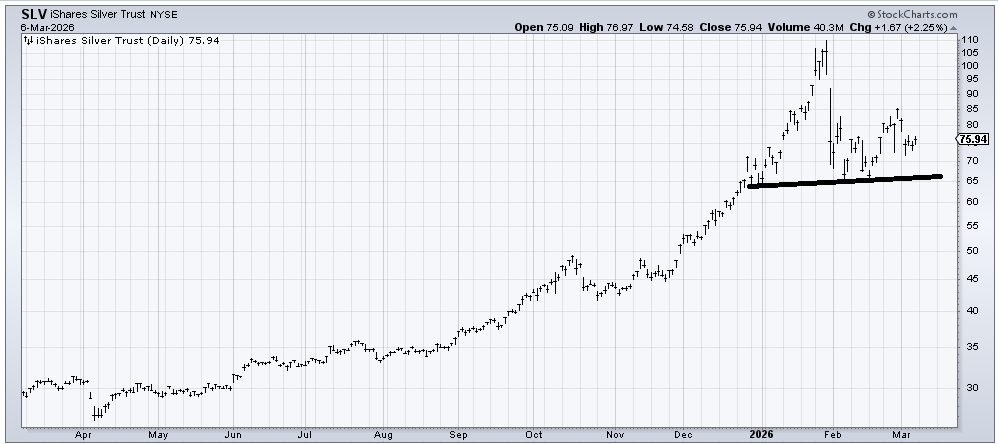
I have said before, I think Silver (SLV) had a bubble burst back in late January, and I am inclined to stay with that view. What would change my mind is if SLV goes sideways for a few months without breaking 65. Then I would be inclined to think this was just a correction, and it’s okay again. So if it stays over 65, it’s okay.
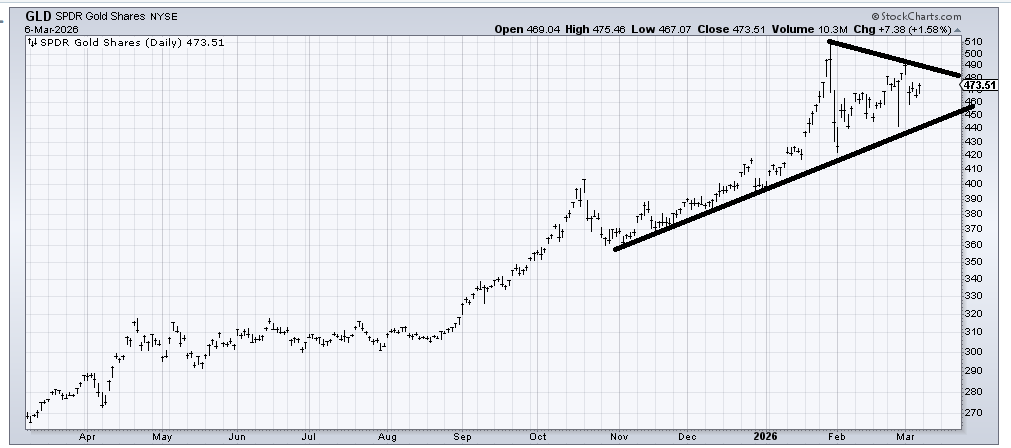
(GLD) has had some wild swings in the last six weeks, but has essentially gone nowhere. I don’t love the wild swings-too erratic for my taste—and it is trapped in a triangle, which is a pattern of indecision. It is shaping up as a support at 440 and resistance in the 490 area. If it can go sideways for a while longer, I might once again like it.
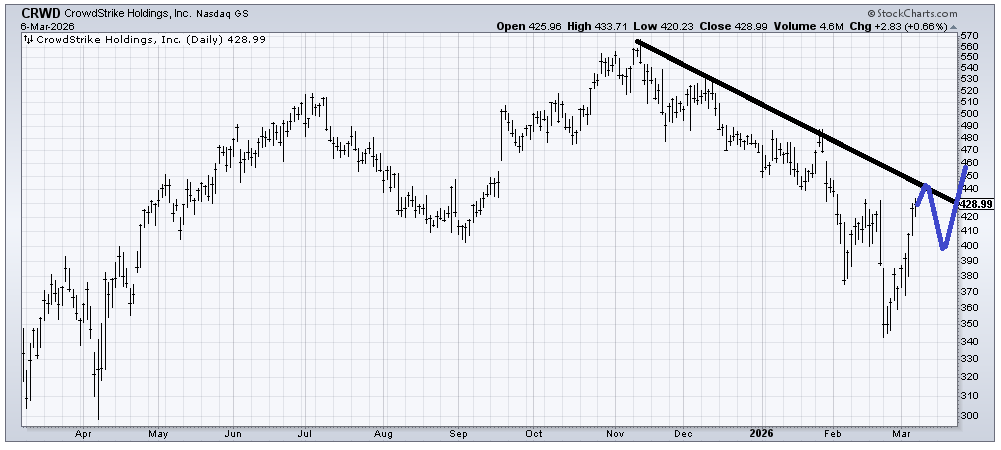
If CrowdStrike (CRWD) can map out something akin to this (remember: the price is not what matters, more the pattern) then I would be inclined to say that low around 345 was the panic low.
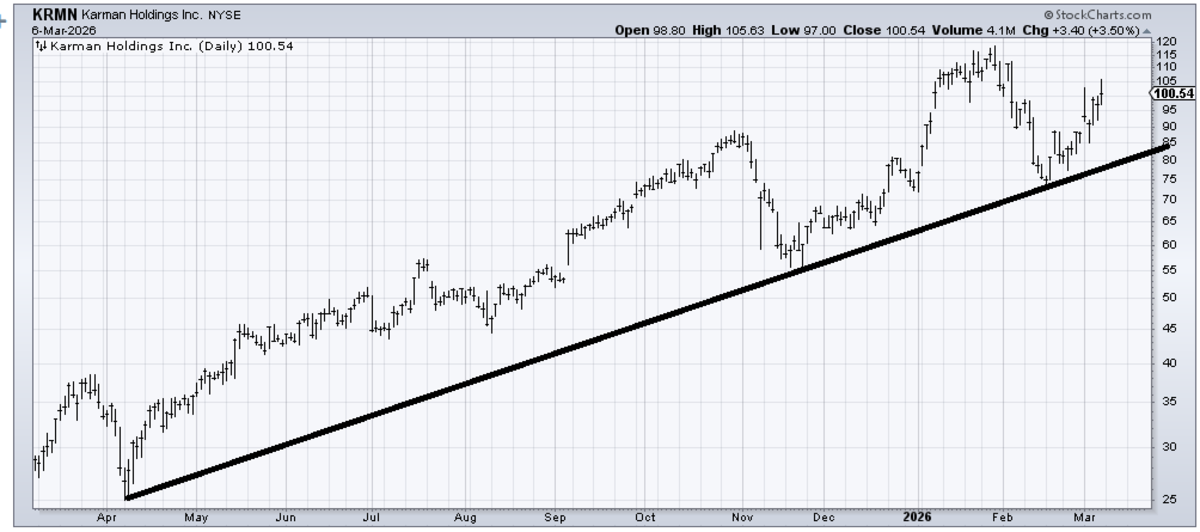
Karman (KRMN) is a stock in an uptrend, but that’s all I see. It trades very thinly, but as long as it stays over that line, it’s fine.
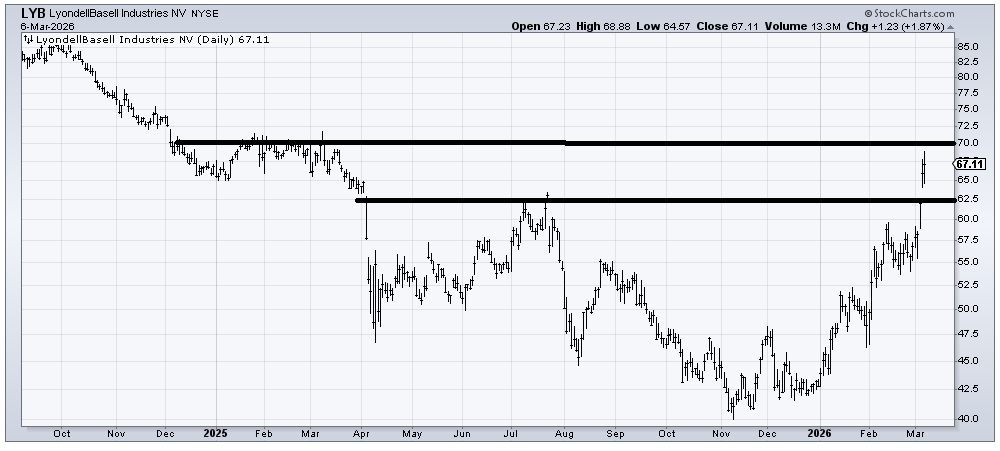
LyndellBasell (LYB) is a nice basing chart. I would feel like I am chasing it up here, but pullbacks into that 60-62 area that don’t break much under 55-ish would be buyable.
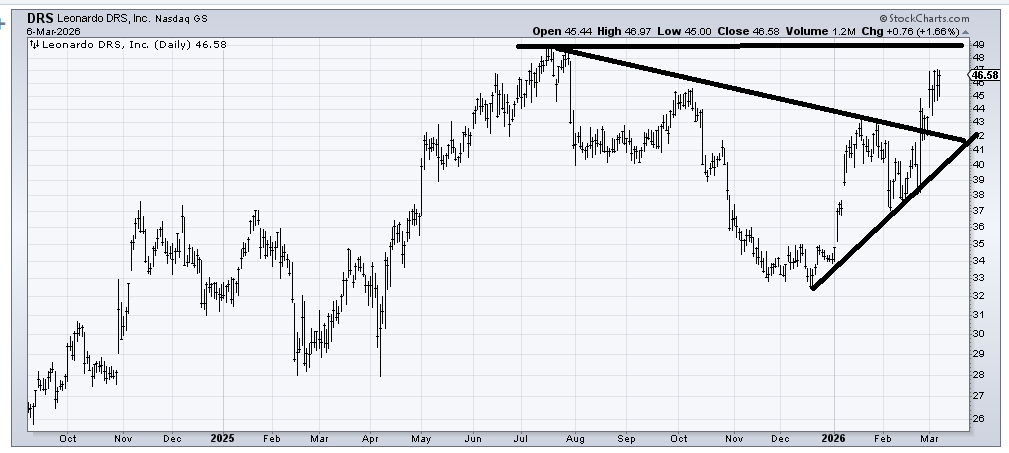
Leonardo DRS (DRS) is not my kind of chart in this sort of market because it is so near the highs (in a down market, I like ‘em down and out) and it has resistance just overhead at 49 from that 2025 summer high. But it is generally a good chart as long as it doesn’t crack back under 40-41. A pullback to 42-43 with a stop under 41 would be ideal.
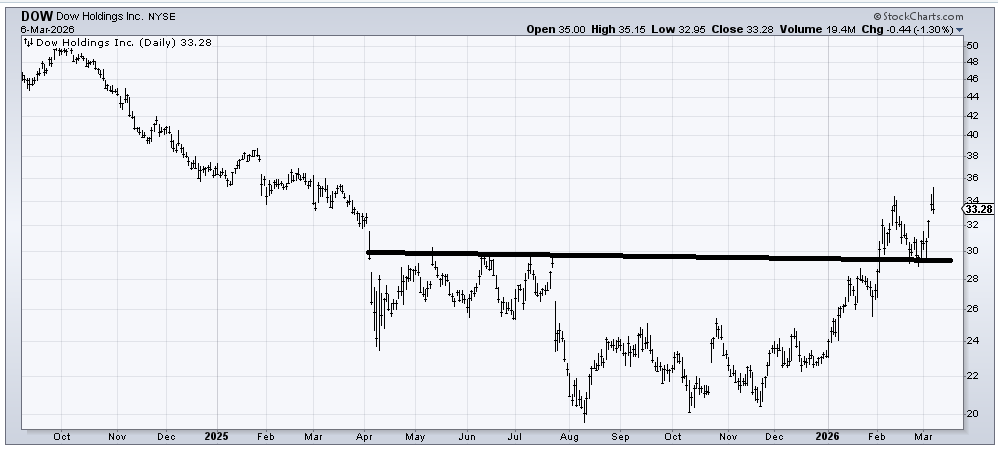
I can’t chase Dow (DOW) because I am just so bad at chasing, but that is a nice chart/base with a measured target near 40. I like the chart.