Options Traders Flash a New Signal as Growth Stocks Rally
It certainly didn't take much for things to turn bullish, but breadth and software tell a more complicated story. Plus looks at IBM, Arm and more.
You've reached your free article limit
You've read 0 of 1 free Pro articles.
The Market
Get growth stocks to rally for more than an hour and everyone turns bullish again.
How do I know? First the chatter. My gosh the chatter! But more importantly, the ISE equity call/put ratio, which I have been harping on about for three weeks now, has been steadily under 2.0 for three weeks with an exception here or there. Wednesday’s reading? 2.42, which is the highest reading since late January.
The CBOE’s put/call ratio was 0.78 Wednesday. That is the lowest reading since January 27. So I am going to reiterate my view that the bearishness we saw rise all month long was associated with the fall in growth stocks and not the overall market.
Now let me note that the various moving average lines of these options ratios all show bearishness is still elevated (one day is not going to change that) so they are not in the same place they were in late January, but it does go to show the weight technology has not just on the market but overall sentiment when it comes to options traders.
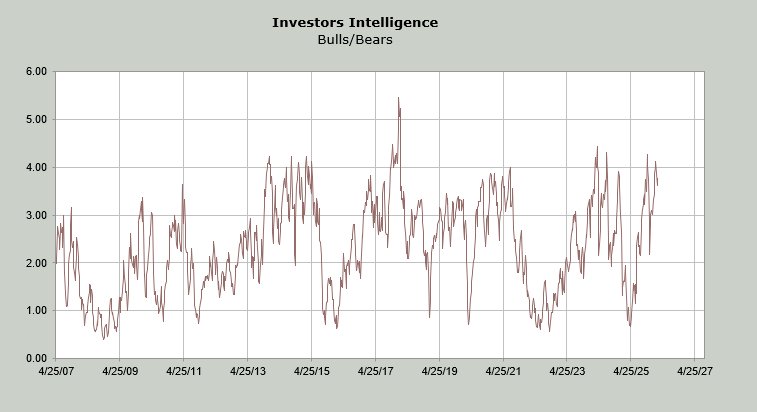
Why do I single out the options indicators? Because the Investors Intelligence bulls lifted one point to 55.6% and the bears fell to 14.8%, which is the lowest since late October/early November. That means the Bull/Bear Ratio has barely budged.
As for breadth, Wednesday was not great. But recall I have said the 493 are overbought and tech is oversold. The Either/Or Market remains intact and it’s hard to see a change right now.
Finally, a word on software stocks (this is now like a daily update!). Several names reported earnings after the bell and many of them are down on the news. The few that come to mind are: Salesforce (CRM) , The Trade Desk (TTD) and Snowflake (SNOW) . I would say the same as I said about Workday (WDAY) Tuesday night: we watch the action. Workday ended in the green.
There ought to continue to be a lot of ups and downs in these names as they sort themselves out and decide who might be the winners and losers. It is a process.
New Ideas
I was asked to do some follow-ups and so I will.
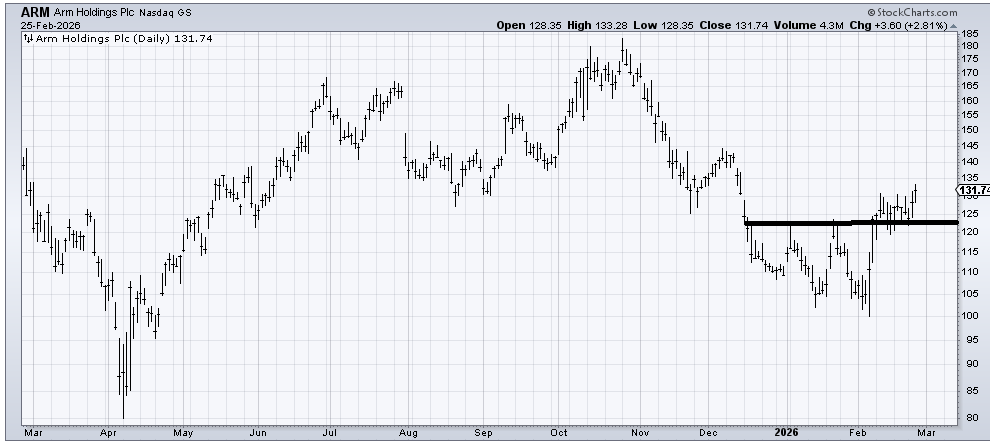
Arm Holdings (ARM) , which I recommended about a month or so ago, has a next target in that $135-140 area. If you squint really hard you can see there is a gap to be filled around $140. It’s far away but the stop is under $120.
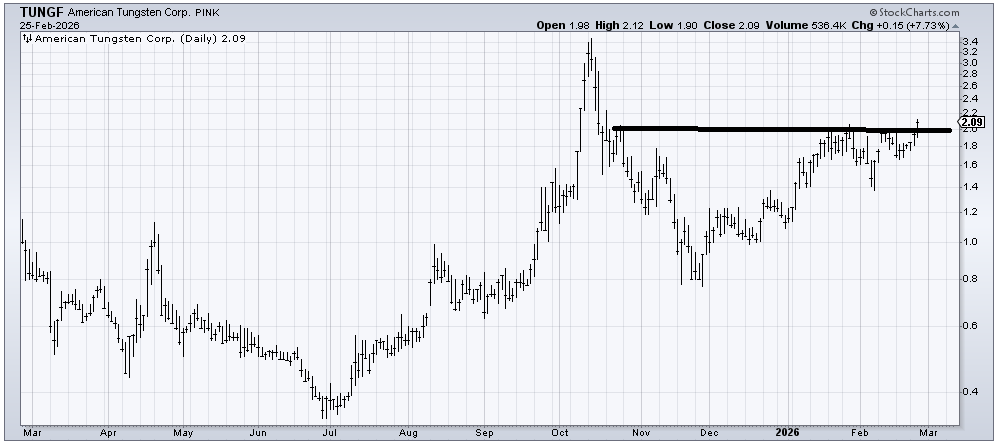
American Tungsten (TUNGF), which I recommended in late December/early January, has been inching up and Wednesday finally crossed over two bucks. I don’t think it gets there quickly, but I have been eyeing that old high area around $3.20-3.40. I do not have a stop in mind, although I ought to!
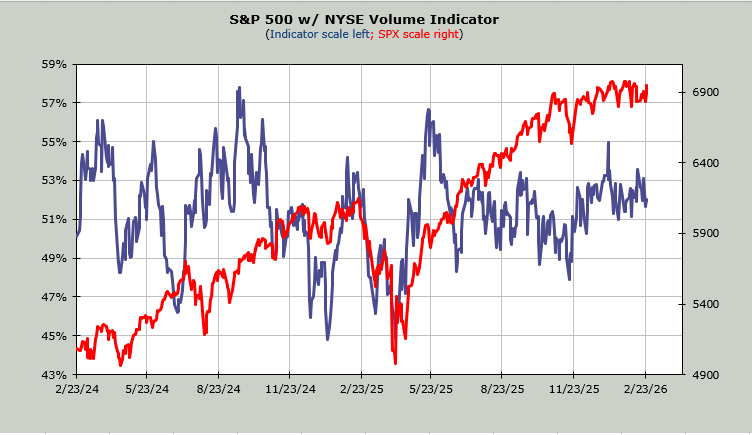
Today’s Indicator
The Volume Indicator is — wait for it — at 52%. I swear it doesn’t budge!
Q&A/Reader’s Feedback
Helene welcomes your questions about Top Stocks and her charting strategy and techniques. Please send an email directly to Helene with your questions. However, please remember that TheStreet.com Top Stocks is not intended to provide personalized investment advice. Email Helene here.
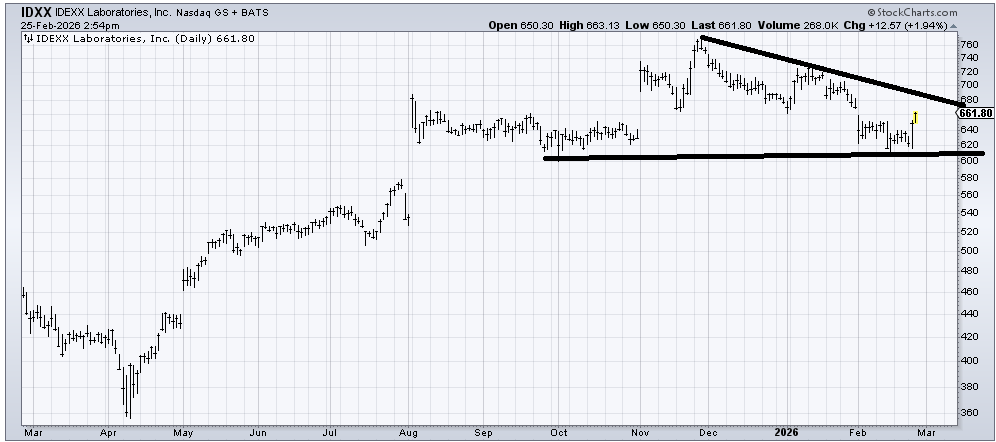
I struggle with charts like IDEXX Labs (IDXX) because it didn’t fill the gap down to $580 and it did not break down. So was there enough selling to get it up and through the resistance that looms overhead at $680? I think for the time being I would say that $680 is resistance but as long as $620 holds on the lower end, the stock is okay.
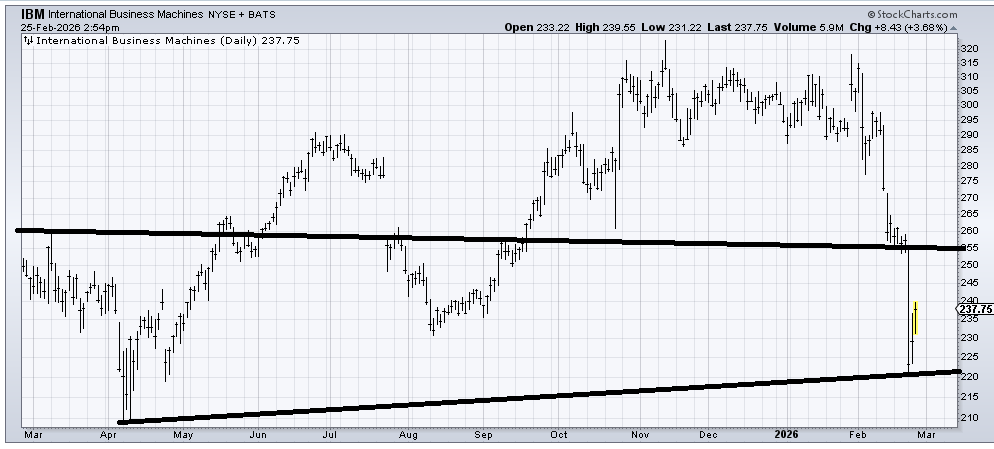
IBM (IBM) had quite a spill, revisiting the April lows. It obviously got oversold enough to bounce (like all the growth/software stocks). For now I will say it is trapped between support in that $220-ish area and resistance in the $250-260 area. I would need a pattern to set up to decide whether or not I think there is more to it.
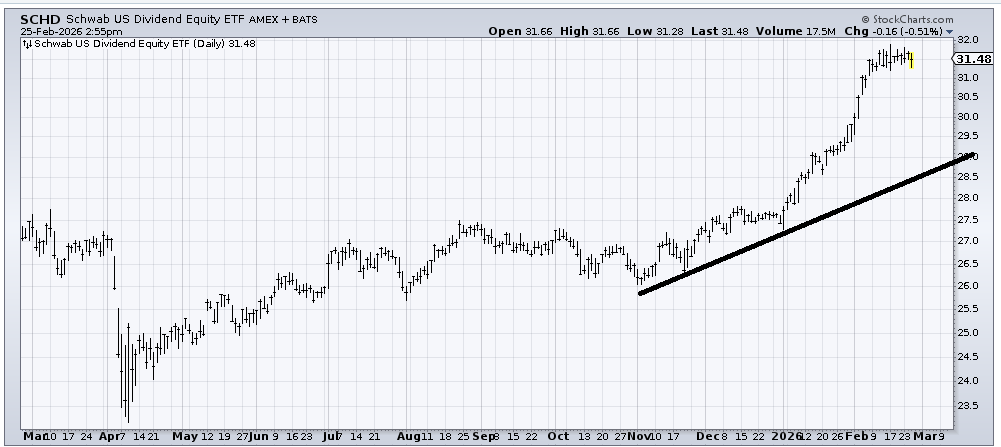
I would say that Schwab U.S. Dividend Equity ETF (SCHD) looks like so many of those "493" charts: over-extended and in need of a correction. But that’s the worst I can say about it.
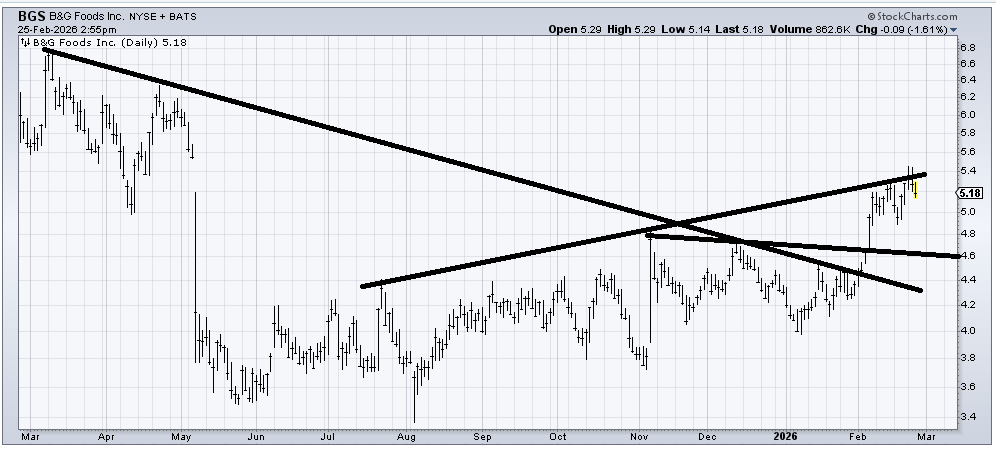
B&G Foods (BGS) has one heckuva dividend so naturally I am interested in it. It has just emerged from a base (you software fans out there should look at this: up and down, lots of trading opportunities before it can be called a base). It also has that gap it just filled (almost) overhead. And it reports earnings next week! If the stock can pull back into that $4.60-4.80 area I would want to take a look at it, and unless it collapses I would probably be a buyer.