One Indicator Will Determine How Weak the Market Is
The news makes you emotional, so mute it and stick to the indicators.
You've reached your free article limit
You've read 0 of 1 free Pro articles.
The Market
There are many people who feel they need a narrative in order to buy or sell. I get that. Wall Street folks seem to have an aversion to buying or selling without a story. Thus, folks want to know if the weekend news (exemptions from tariffs on much/most technology) changes the charts or indicators. The answer is no.
To review where we are. We finally had panic on Friday, April 4th when over 90% of the volume chimed in on the NYSE. We finally got some high put/call ratios. We got the DSI on Nasdaq at 9 and the S&P at 10. Folks finally sold their winners like the staples and even gold. We got oversold (Nasdaq Momentum Indicator, the ‘what if’ for the Nasdaq McClellan Summation Index, the Hi-Lo Indicator).
We finally got that move to Panic (from the Sentiment Cycle chart) and the rebound off it. It has been my contention that we are now in that period of time after the initial rebound from Panic. I have boxed the area in green.
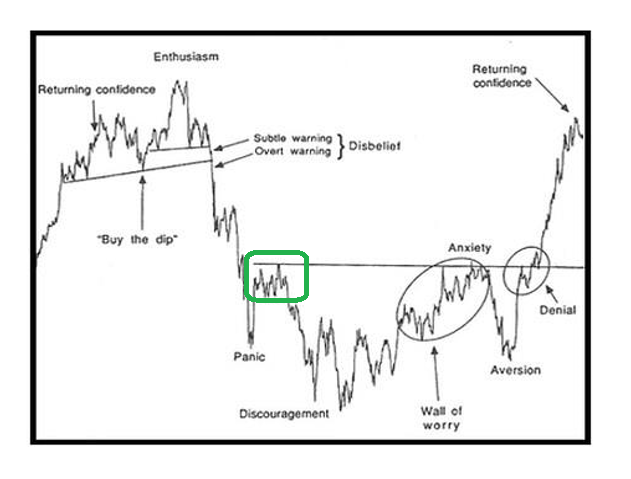
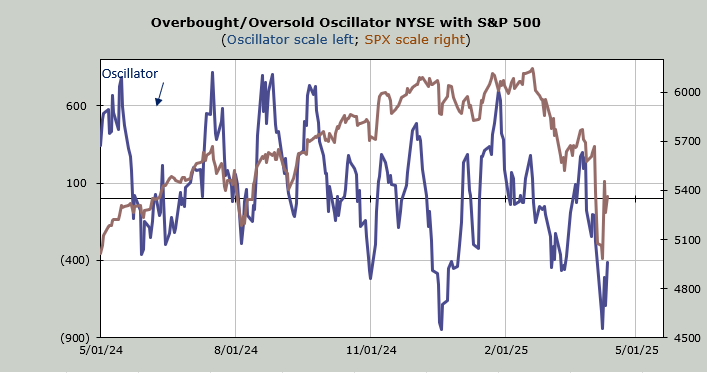
The indicators have said we could/should pull back or get choppy and rally again. The chart above says that too. It’s a bit too soon to say when we would be firmly back to an overbought period, but my initial impression has been late this week. Much of what transpires early this week will determine that. But I said I expect my Overbought/Oversold Oscillator to get to and probably over the zero line. If it can’t make it to the line, the market is a lot weaker than I think it is.
I do imagine that after we finish that green box action, we will then come down again. The timing doesn’t have to be the same as it is on the chart, and it is unlikely the pattern will continue to be so exacting, but as we saw on the charts, we looked at Thursday night, there has been a lot of damage, and there is still work to be done.
Will the news matter? Perhaps. It always does but I prefer to stick to the indicators and mute the news because the news makes you emotional. But I did say that the rally was most likely to come in technology, particularly the semis (SOX). Sometimes, the charts just know.
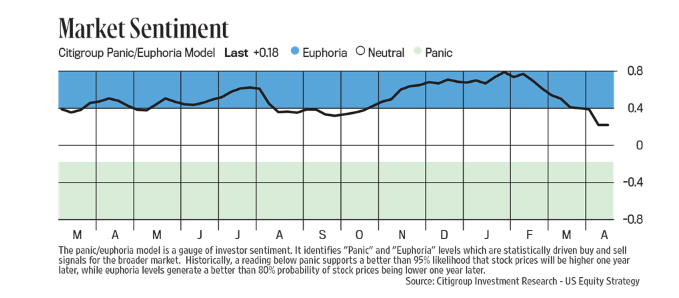
Speaking of emotions, the Citi Panic/Euphoria Model had quite a move last week. It didn’t get to Panic, but for the first time in more than a year it fell out of Euphoria in a significant way.
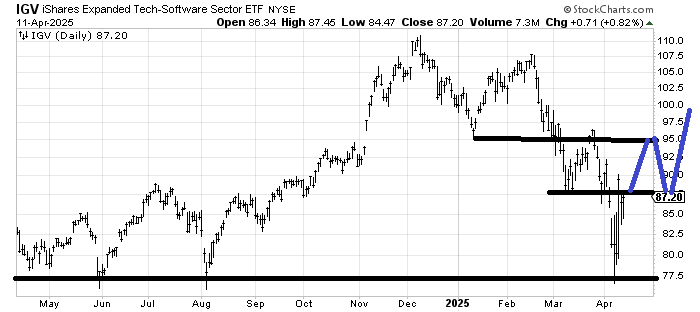
The ratio of the SOX to Nasdaq ticked back up ever so slightly on Friday. I’ll continue to monitor that for signs of weakness or strength. In the meantime, let’s also focus on software, the chart of IGV has me intrigued because it did not make a lower low and it has scurried right back to first resistance already. I now wonder if it can map out as I have drawn in blue. It just seems to act differently than most other technology right now.
One final word on sentiment. Friday’s equity put/call ratio sunk to .43 which tells me folks are going to get bullish in a hurry. A wall of worry is bullish; jumping back on the rally bandwagon so quickly is typically not.
New Ideas
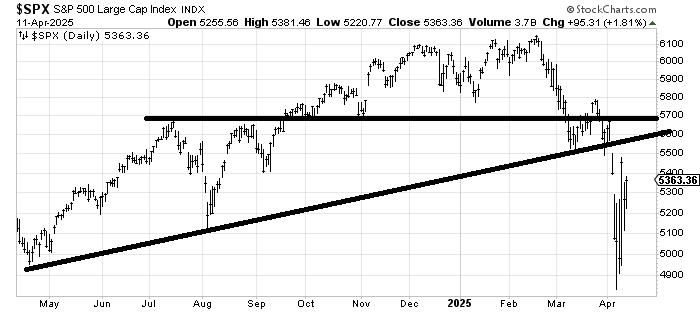
As a reminder, I am still waiting for the S&P to get to resistance, with the first around 5500 and the other around 5700.
Today’s Indicator
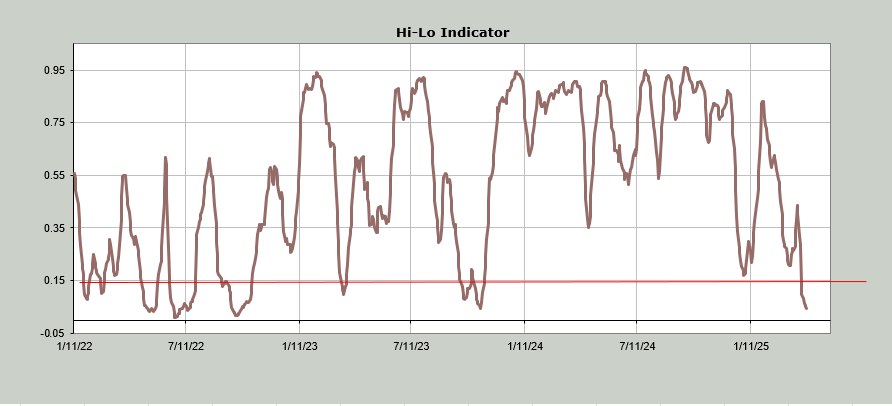
The Hi-Lo Indicator for both the NYSE and Nasdaq sits in oversold territory at .05
Q&A/Reader’s Feedback
Helene welcomes your questions about Top Stocks and her charting strategy and techniques. Please send an email directly to Helene with your questions. However, please remember that TheStreet.com Top Stocks is not intended to provide personalized investment advice. Email Helene here.
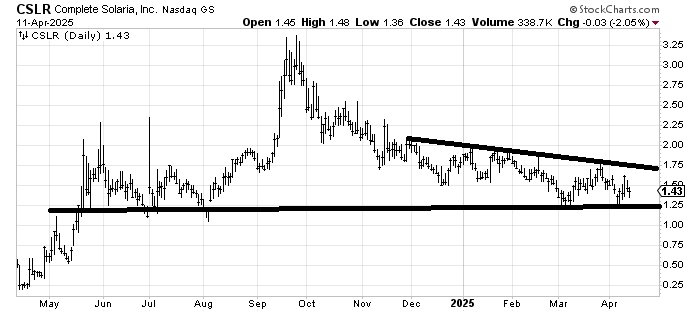
I’m not sure this is the environment for small-cap stocks that trade at a buck and that is what Complete Solaria CSLR is. The stock is acting sold out, so as long as it holds over 1.25, it gets a chance to prove itself. In a different market environment, I’d warm up to this type of chart, even if it looks early.
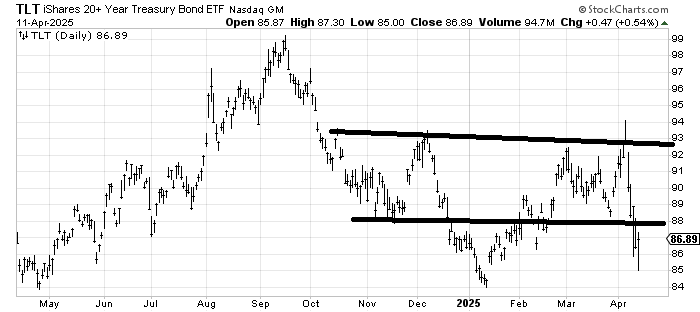
So much for my thinking TLT would trade between 93 and 88 for a time. Last week it traded over 93 and then went plop, then it traded under 88 and is trying to get back over 88. I think it can get back over 88, and if I am correct, I would continue to think we’re in that range for the time being. If it can’t get over 88 then the stock market is not going to like it.
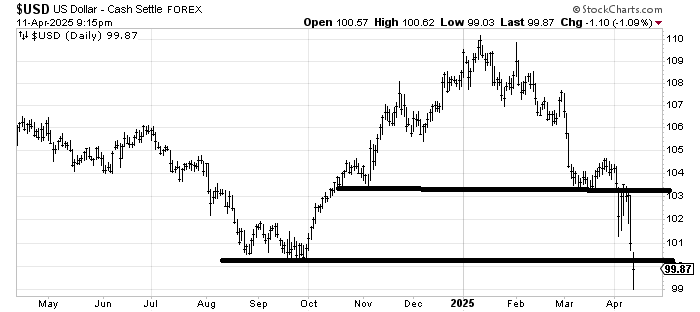
The Dollar Index (DXY collapsed last week, and it really ought to get back over 100. If it can’t do that, then stocks are going right back down; they are not waiting until we get overbought. I had expected the DSI for the DXY to be much lower than it is, but it is at 38, so there is no extreme here. The Euro, the largest component in the DXY, has a DSI of 82. Then Yen sits at 60. So this is probably the chart to watch.
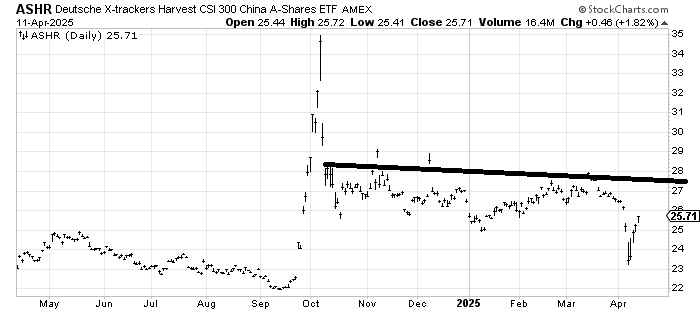
ASHR an ETF to be long the Chinese A shares almost filled that gap from September, but the chart has so many gaps I wouldn’t put a lot of stock in it. What I would note is that there is so much resistance between 26-27 now. It’s hard to imagine it can plow right through there.
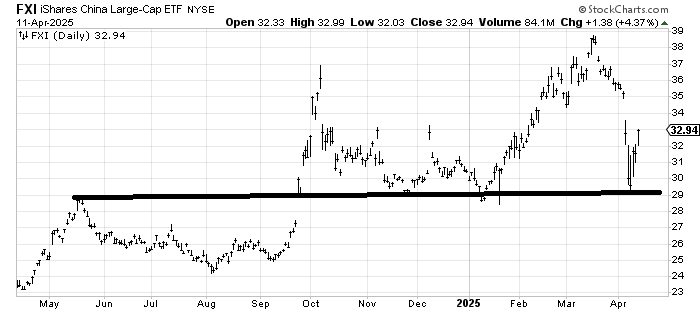
I had wanted FXI to come down to 33, but it had other ideas and, instead, came all the way back to the bottom of support at 29. Now, it has resistance at 33-35. My inclination is to see if it can fill the gap and then just go quietly sideways without much violence. Then, take another look. Because if we step back the chart has been in a giant sideways since October.
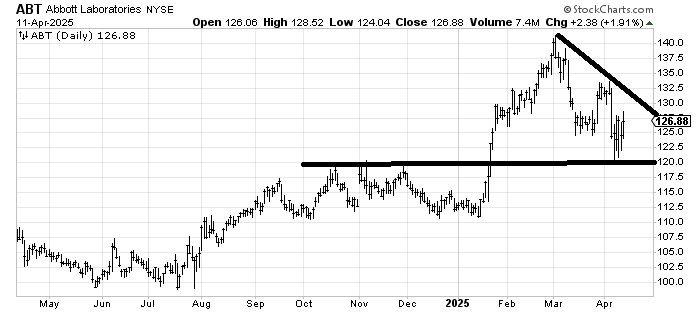
In the big picture, Abbott Labs ABT looks like a stock that broke out and has come back to test the breakout, so on a longer-term basis, this is the area we should like the chart. On a short-term basis, 132-133 is going to be resistance. I’d like to see it cross that downtrend line.
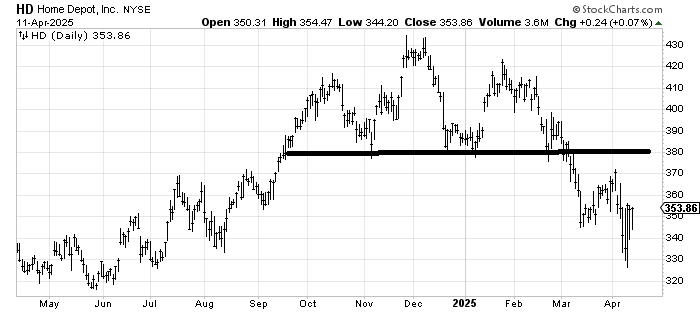
Home Depot HD met its measured target from that head and shoulders top when it tagged 330 last week. Quite frankly, it acts better than it ought to. It needs to get over 360 to show me not only has the selling dried up but there is some buying too. For a trade, it ought to get over it.