Once the Indicators Got Moving, They Really Moved
A bit more downside action early next week, and the setup will be short-term oversold.
You've reached your free article limit
You've read 0 of 1 free Pro articles.
The Market
Once the indicators got going, they really moved.
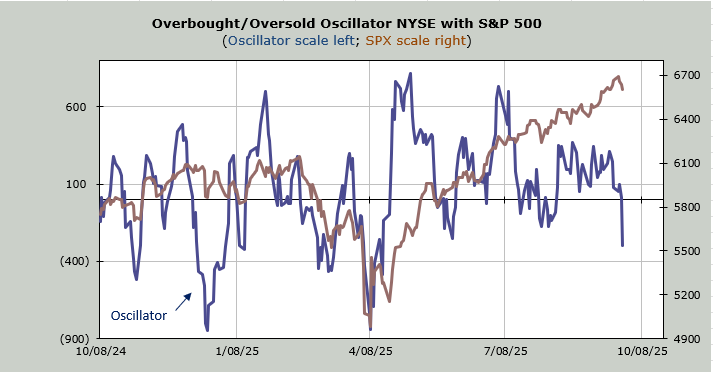
Just take a look at the Overbought/Oversold Oscillator. That’s a plunge. It’s also lower than it was in early August. I would call it a tiny bit oversold. If we can get some more downside action in the early part of next week, it will set up as decently (short-term) oversold late next week.
While we’ll wait to see if we can get that set up, let me just remind you that earlier this week was Rosh Hashanah, the Jewish New Year. There is an old adage that we should sell before Rosh Hashanah and buy before Yom Kippur, the Day of Atonement. It turns out a week from today (Thursday, October 2) is Yom Kippur.
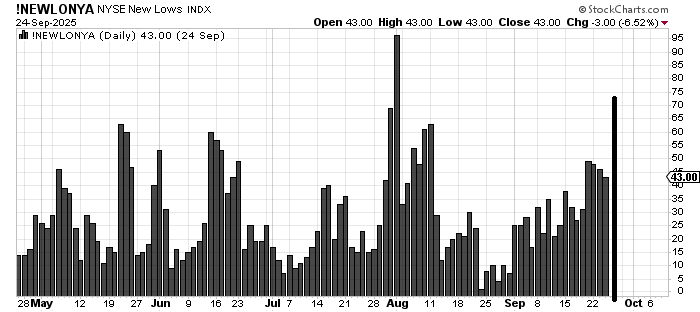
The number of stocks making new lows jumped today, with the NYSE clocking in at 72, the most since early August.
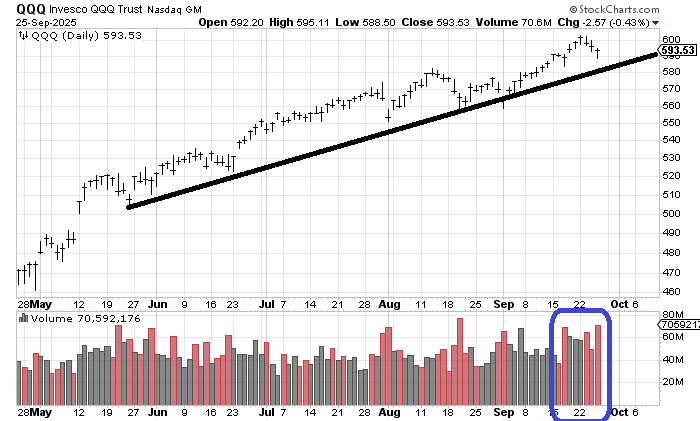
I may as well point out that the volume in the QQQs clocked in at 70 million, which leans high and tends to be short-term bullish. I’d love to see the QQQs tag that uptrend line.
There was very little selling in many of the tech names, but the drugs as a group got smacked today. All in all, I would say that the action over the past two weeks continues to be very sloppy in the majority of stocks.
New Ideas
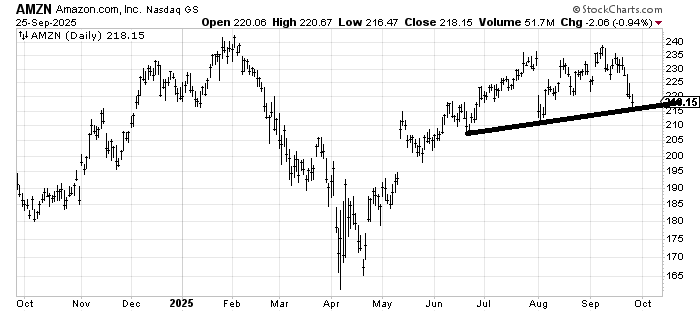
I am quite focused on Amazon (AMZN) these days. You might recall I was asked about it in early September when the stock was 235, and I noted that it seemed to have trouble getting through, so I’d rather wait for a breakout rather than anticipate. It has since fallen nearly 10% and the oddity is no one even talks about it. More than that, it is getting short-term oversold and sitting at support. If it can’t hang on and rally from here, I am going to start talking about it as I did Microsoft in January and February.
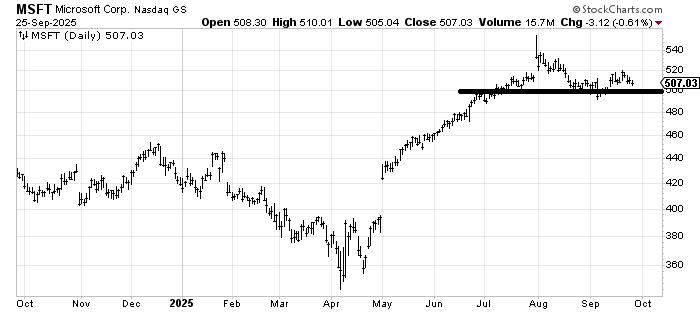
Speaking of Microsoft (MSFT) , it made its high in early August and is now trading back at July levels. When we last looked at it, the stock was around 500 and I thought that it was OK as long as it held 500. It had a mediocre rally and is now coming back down. It’s a thick line but this 500 area is worth paying attention to.
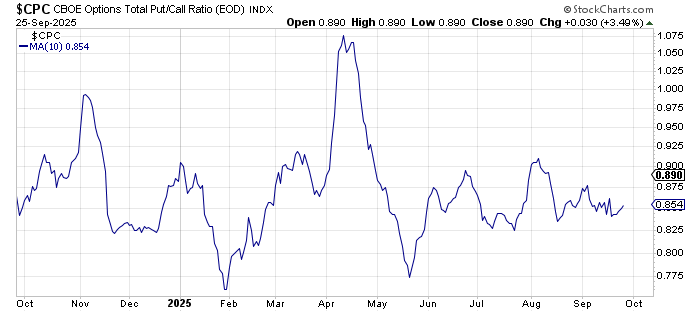
Today’s Indicator
The 10-day moving average of the put/call ratio is low.
Q&A/Reader’s Feedback
Helene welcomes your questions about Top Stocks and her charting strategy and techniques. Please send an email directly to Helene with your questions. However, please remember that TheStreet.com Top Stocks is not intended to provide personalized investment advice. Email Helene here.
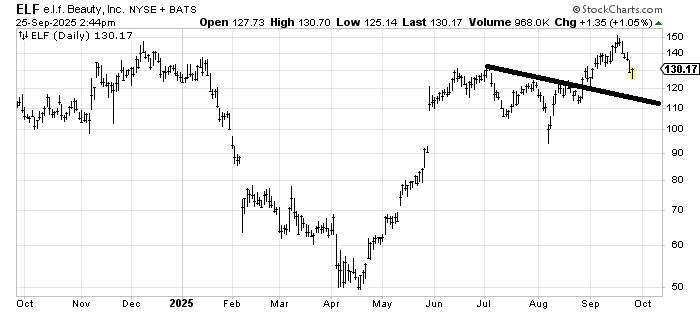
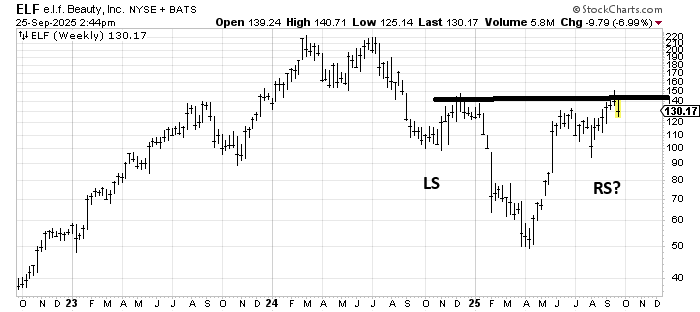
We looked at e.l.f. Beauty (ELF) a few months ago and I leaned positive on it. In the near term it’s got some support in this 120-ish area and hasn’t had a failing rally yet, but let’s look at the weekly chart. You see that head and shoulders bottom (potential)? It's what I saw a few months ago. My issue is that I don’t know where to put a stop in as 110 seems quite far away. But that’s what I’m searching for.
As a side note. I just found out what e.l.f. stands for and I feel as if I should have known well before this!
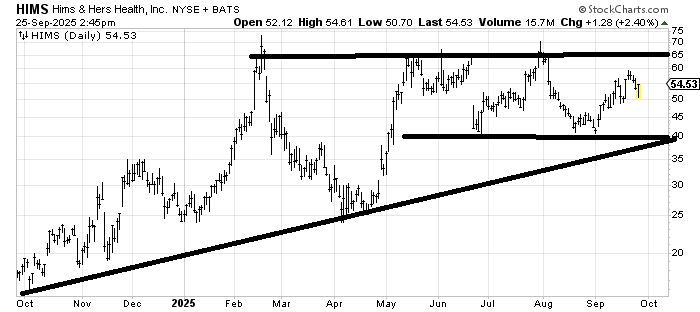
I don’t like the fact that Hims & Hers Health (HIMS) hasn’t made a higher high since February. Each time it has tried to break out over that level, it has been turned back. The good news is that the same low (40) has held each time. The bad news is the latest rally couldn’t even get up that far. For now I will call it a trading range of 40-70 but it’s on the watch list for possibly building a top.
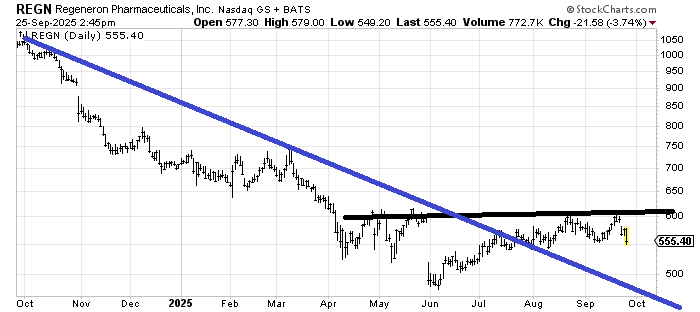
Maybe the action in Regeneron (REGN) is end-of-the-quarter or early tax-loss selling, but right now I am inclined to stay away from it, especially if it breaks 550 (the July and August lows).