Once Again, It Is Price That Changes Sentiment
The bulls are back! Let's examine what happened last time we saw such a large jump in bulls.
You've reached your free article limit
You've read 0 of 1 free Pro articles.
The Market
With an early close on Thursday and Friday a holiday, the next edition of Top Stocks will be this weekend.
It seems all it took was the others, or the 493, or the RSP, or whatever you want to call them, to rally to get everyone all on board. Yes, sentiment has changed. Is it fully over-the-top bullish? Not quite, but pushing there.
First, today’s ISE Equity call/put ratio was 2.72. That is the highest reading since March 17th. There were some earlier readings in the waning days of January and in February that saw higher readings, but this is pretty lofty and the loftiest we’ve seen since the rally started.
Then there is the DSI. It only notched up to 83 for both the S&P and Nasdaq so it’s not yet ‘there’ but as I noted earlier this week, should we see the market rally into the end of the week (Employment report tomorrow morning) it is quite possible, even likely that if the market rallies, we’ll see this at 85 or higher. The DSI for the VIX is 20.
Then there is the very slow-moving, but this week explosive, move in the Investors Intelligence bulls. They jumped to 51%. But the bears fell as well to 27.4%. Neither reading is extreme. What is extreme is the week-over-week jump.
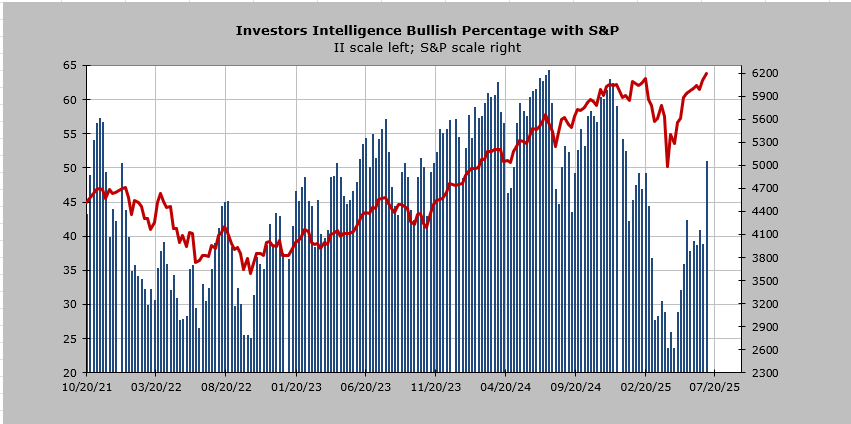
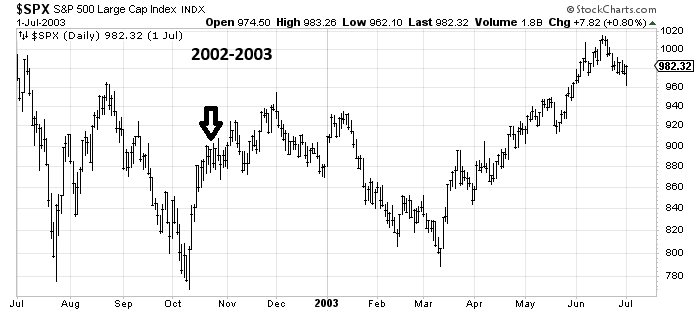
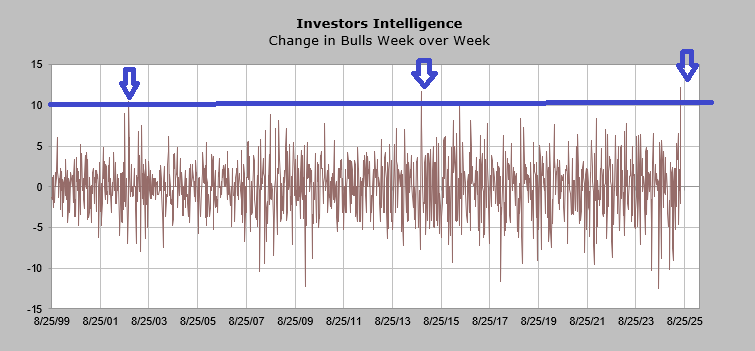
The Bulls jumped 12.2 points this week. That is so rare that in the last 30+ years, we’ve only seen a jump of ten points or more two other times. Coming off the October 2002 low, we saw the bulls jump just over ten points about two weeks later (arrow on the chart). If you step back and look, you will see we did push upward some more, but mostly it came pretty late in the rally—before we headed back down.
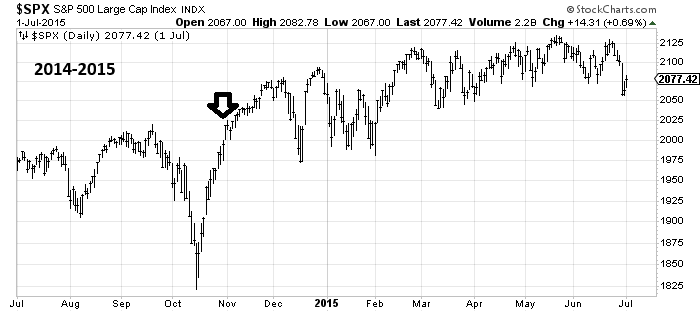
In 2014, the outcome was different, maybe slightly better, but also not great. Here, too, the jump was in October, coming off the low, and it was 2-3 weeks after the low (arrow). You can see we had some more in the tank, but then we gave it all back and spent months with a mostly sideways tape.
The main difference, as best I can tell—and I realize there are only two instances here—is that folks turned bullish a couple of weeks after the low. This time, it is months later, and thus it really does feel late. Let’s see if the Jobs report tomorrow can get that DSI to/over 85.
New Ideas
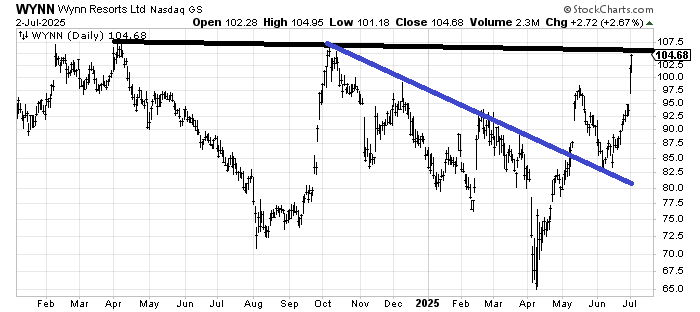
In early June, when Wynn Resorts WYNN bounced off that blue line, I recommended it. IT’s had a terrific run and now finds itself at resistance. It hasn’t done anything wrong, so my guess is it pulls back and rallies again, but this is not some tech stock, and it’s up over 20% so you might want to take a little something off the table.
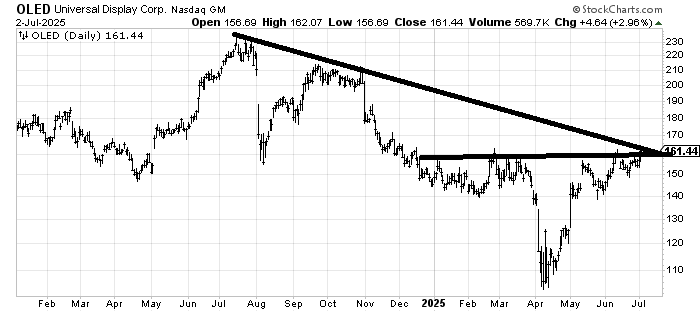
Universal Display OLED has been building a base this year. As long as it doesn’t fall back under 150, it should have a breakout attempt.
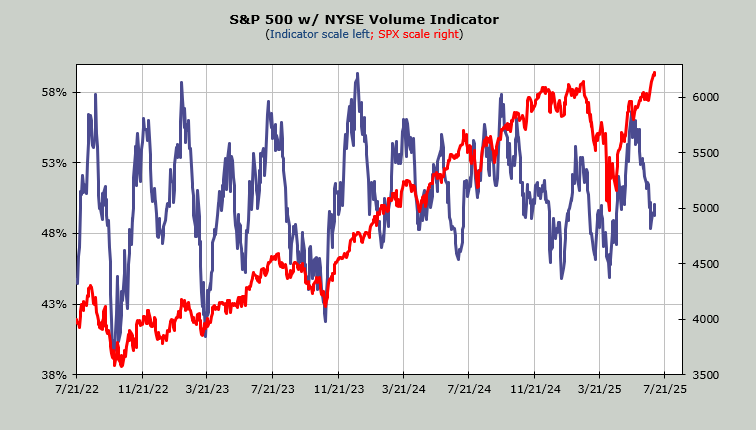
Today’s Indicator
The Volume Indicator is at 50%. I am surprised it hasn’t rallied at all.
Q&A/Reader’s Feedback
The request list is long (thank you!), so if you don’t see your name here today, I will get to it on the weekend.
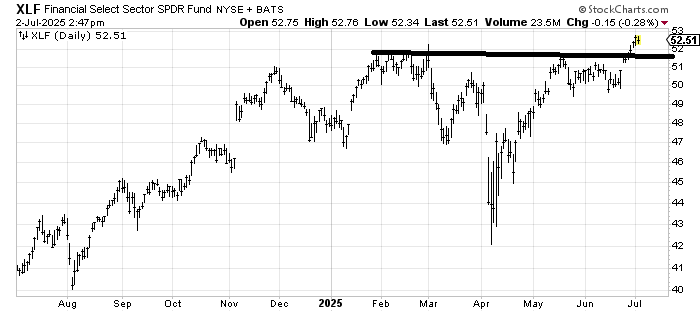
I was asked for a target on the Financial Select Sector SPDR XLF. The measured target would be around 60-62. A pullback to the 51-52 area would be a big plus, though, since this feels more like it’s creeping upward rather than a breakout. Under 50, and we’d call this a false breakout.
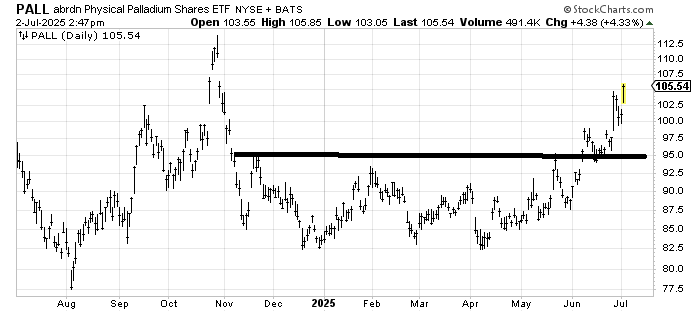
I was asked for a target on abrdn Physical Palladium Shares PALL, an ETF to be long palladium that I recommended a few months back. The measured target is right there where that gap fills (from October, call it 107-110 for this move.
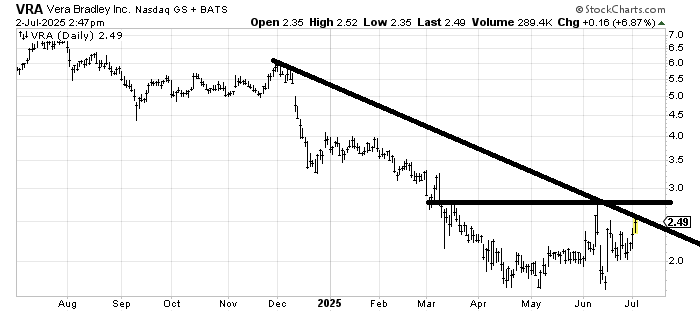
Vera Bradley VRA looks more like a chart that is participating because it got clobbered in June. I’d think 3-ish looks tough with an outside shot at 3.50 where the resistance begins in earnest.
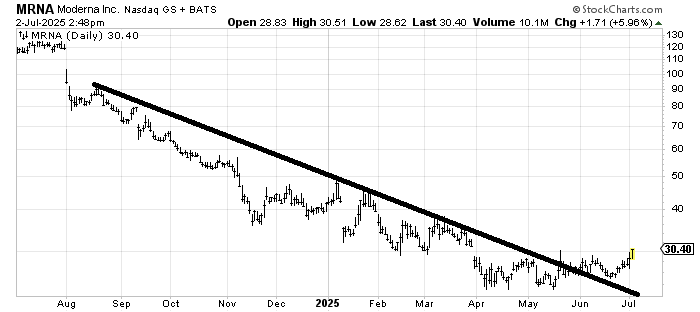
Let’s face it: if Moderna MRNA is rallying, we know we’re at the stage where folks are lifting anything that is down and out. Resistance begins right here at 30-32, but I would say if the chart turns back under 28-ish, I’d get concerned.
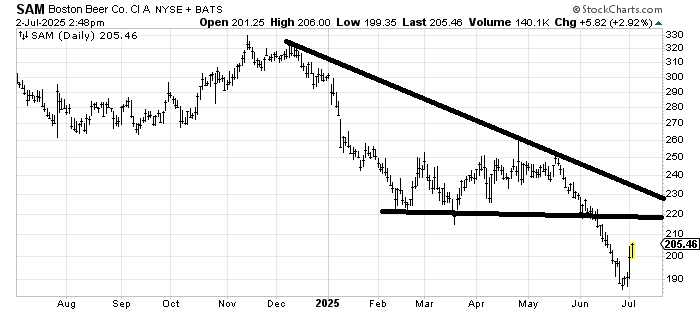
If Boston Beer SAM gets to 220-ish, consider it a gift.
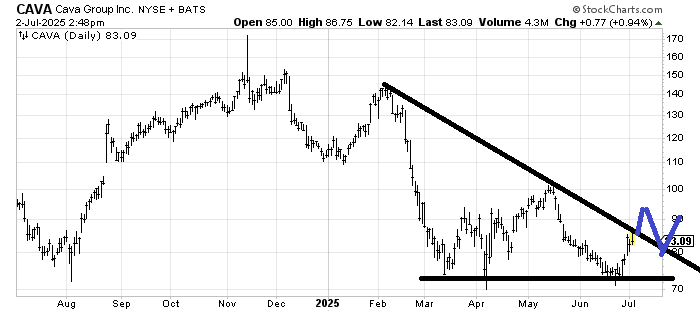
Cava CAVA is hard to get too excited over because it is a former growth stock, and those tend to have a lot of false starts on bottom fishing rallies. If it can get through this downtrend line (big if), then I would imagine it trades as I have drawn in blue.
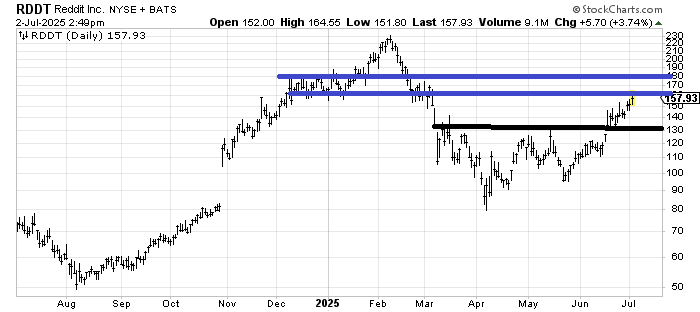
Reddit RDDT has a lot of resistance from here to 180-ish, so it’s difficult to get excited over it.
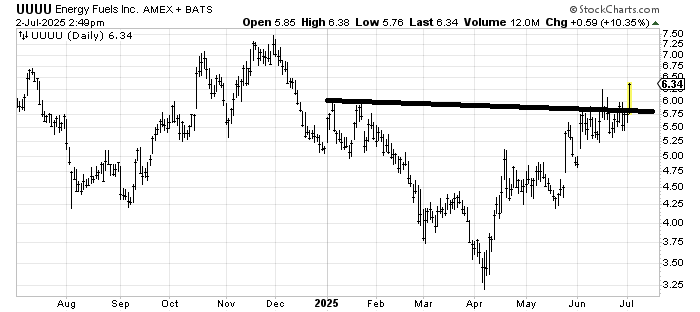
Energy Fuels UUUU measures to that old high around 7.50 and maybe to around 8. Under 5.50 and I am wrong. Obviously the stock trades thinly. Also, it has a great ticker symbol.
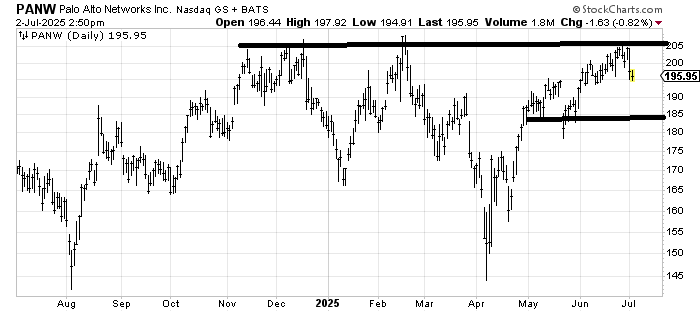
I have a confession to make: I have been jotting down Palo Alto Networks PANW and Cyber Ark CYBR for weeks now, wondering why they can’t break out, and now I have been asked about PANW. There is support at 185-190 on the chart (lower line), but mostly it looks to me like a stock going nowhere for the time being. I guess cybersecurity is not a hot place to be these days. If the stock can hold support and start to curl under, perhaps it gets more interesting in time.
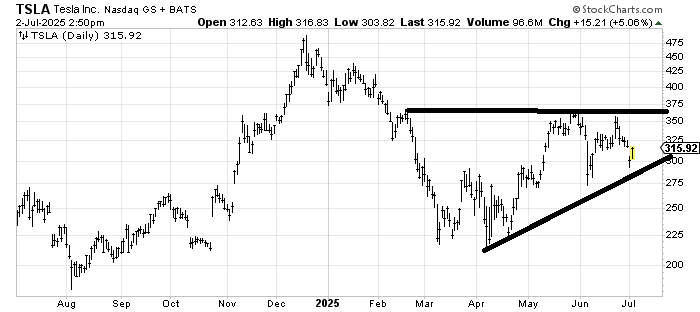
Tesla TSLA is actually not terrible despite how bad the numbers are (I cannot believe I am saying this!). The stop would be far away, under 275, but for now I’d say it’s mostly rangebound 275-375.
Helene welcomes your questions about Top Stocks and her charting strategy and techniques. Please send an email directly to Helene with your questions. However, please remember that TheStreet.com Top Stocks is not intended to provide personalized investment advice. Email Helene here.
