On a Day that the S&P Falls Over 2%, Is This Tech Giant Finally a Buy?
We'll recap key indicators of where stocks might be headed and then look at this tech stock that's finally setting up for a bounce.
You've reached your free article limit
You've read 0 of 1 free Pro articles.
The Market
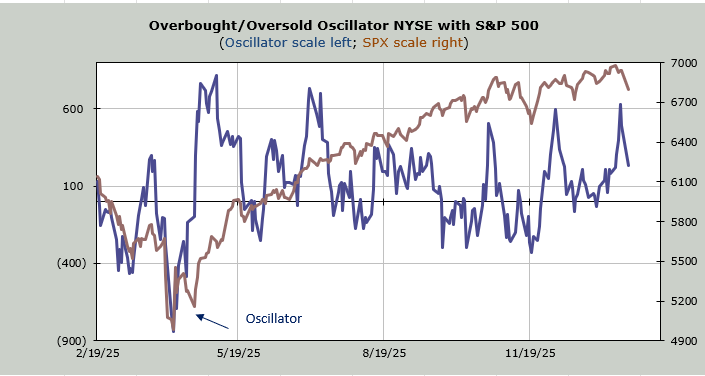
Every once in a while, the indicators work like a charm. And they did so in the last few days as we headed into an overbought condition last Friday, coupled with overly complacent sentiment.
The question we must deal with now is if this is going to be a one-day pullback or something more. I think something more. I’m not sure we’ll head south again tomorrow, but for my indicators to get oversold, I am going to need to see breadth negative for more than two days. The good news is the Oscillator has started the process.
Most of the selling came in tech-land since only 70% of the volume was on the downside. But what’s even more curious is that Nasdaq saw only 62% of the volume on the downside.
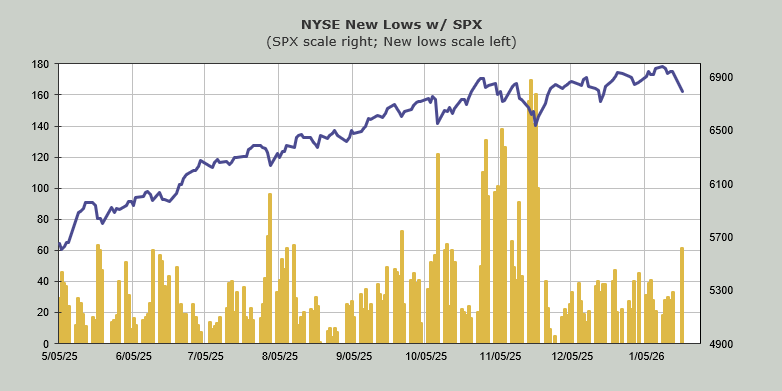
Then there is the number of stocks making new lows. The NYSE saw a surge in new lows, nearly doubling from Friday to 61. It was the largest number since November.
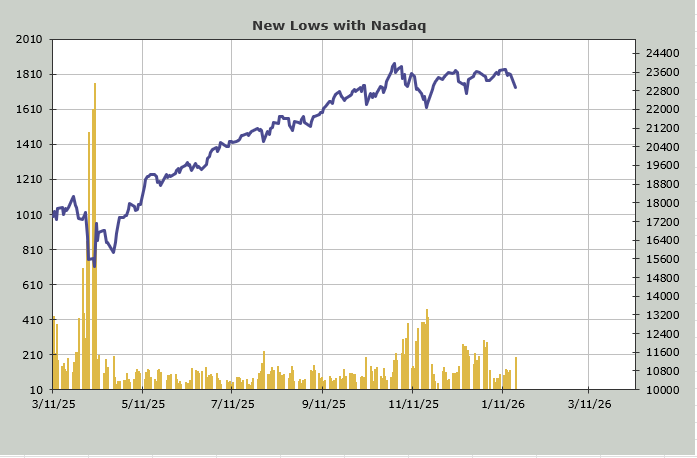
Nasdaq, however, saw new lows jump to 195, which I grant you is high, but take a look at the chart, and you can see we saw 267 new lows on Nasdaq in mid-December. So, despite all the selling in tech-land, the new lows on Nasdaq are still fewer than a month ago.
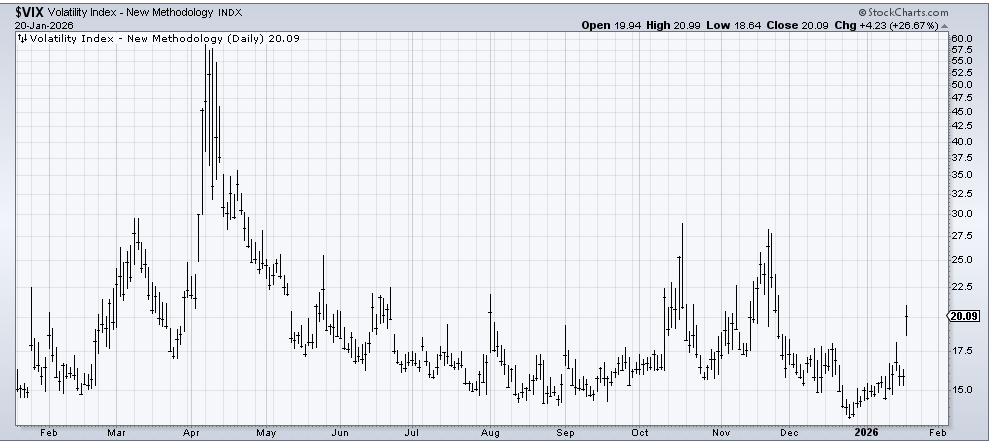
We did not see the put/call ratio jump. Sure, it went up to .87, but on a day the S&P falls two percent, it should be over .90. We did, however, finally see the VIX get itself going. I don’t have a strong sense if it plays out as it did in April or is more like October or November, but again, it is finally doing what it ought to, and that is head toward a situation where it is jumpy.
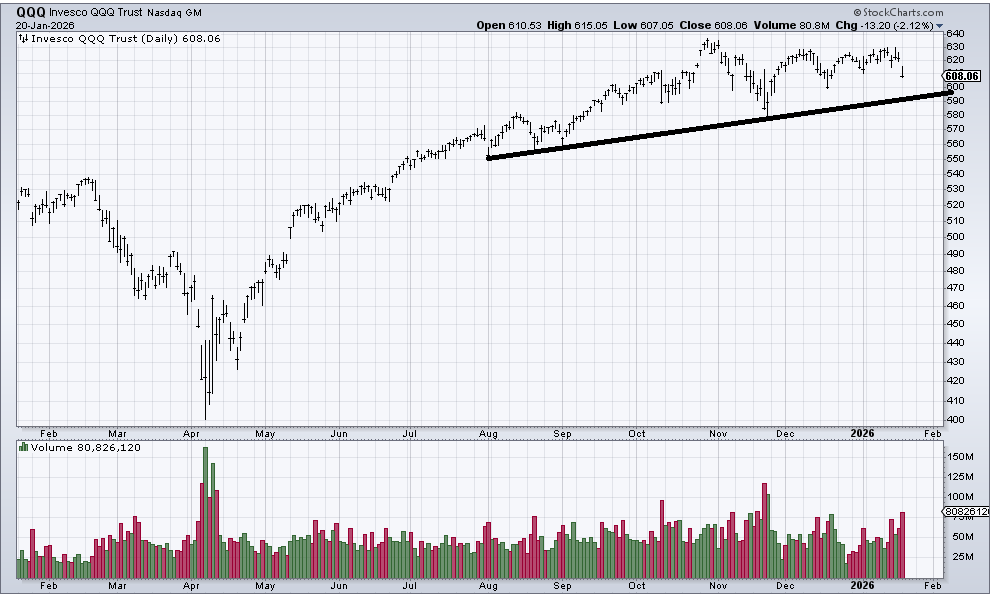
Finally, there are the (QQQ) s. The chart looks bad because it looks toppy, although there are no lower lows (yet). The volume jumped up to 80 million shares, so at least we know there was finally some decent selling in this well-watched and over-owned ETF. For now, I’ve got my eyes on the 590-600 area because that is initial support. Let’s see if it can get down there.
New Ideas
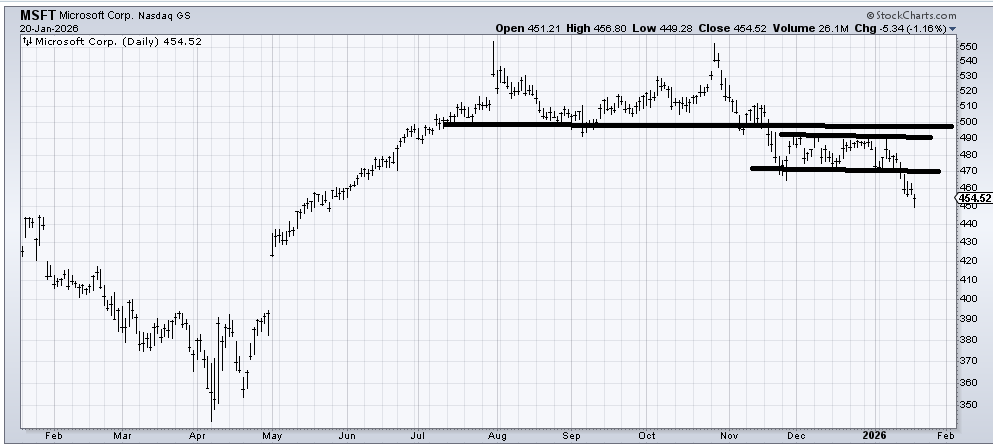
I turned sour on Microsoft (MSFT) when it couldn’t recapture that 500 area after three attempts. It has now fallen out of the sideways action for the last two months. But I want to do a little math after I point out that the stock closed well off its lows today.
The first math is the twin highs are at 550. The break was at 500, which gives us 50. Fifty from 500 gives us 450.
The sideways action was from 490 to 470. That gives us 20. Twenty from 470 gives us 450. The low of the day today was 449 and change. Microsoft is almost due for a bounce. I only see it as a bounce for now, but if you are looking to play a short-term bounce, that’s it.
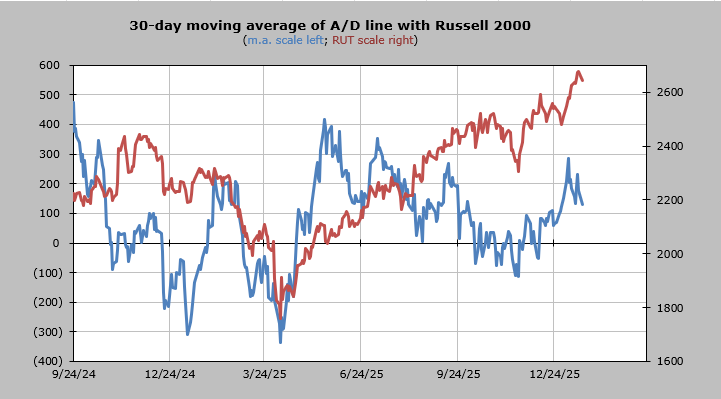
Today’s Indicator
The 30-day moving average of the advance/decline line got overbought last week.
Q&A/Reader’s Feedback
Helene welcomes your questions about Top Stocks and her charting strategy and techniques. Please send an email directly to Helene with your questions. However, please remember that TheStreet.com Top Stocks is not intended to provide personalized investment advice. Email Helene here.
There is one theme in today’s requested charts: so many stocks are in the middle of nowhere, trapped between support and resistance. If we can get them down to support when we get oversold, they get more interesting.
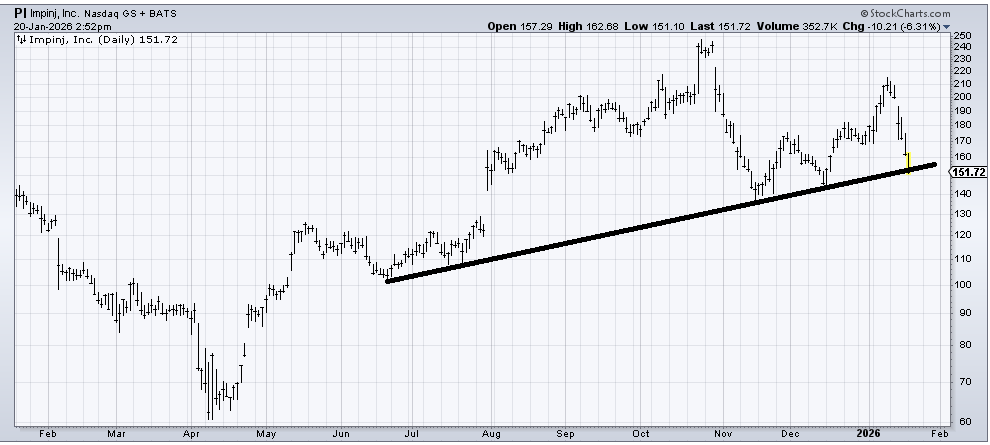
Impinj (PI) is coming into some support now, but even if it bounces, I’d be very careful if it does not bounce well, because if it can’t bounce well, I think 120-30 is coming next.
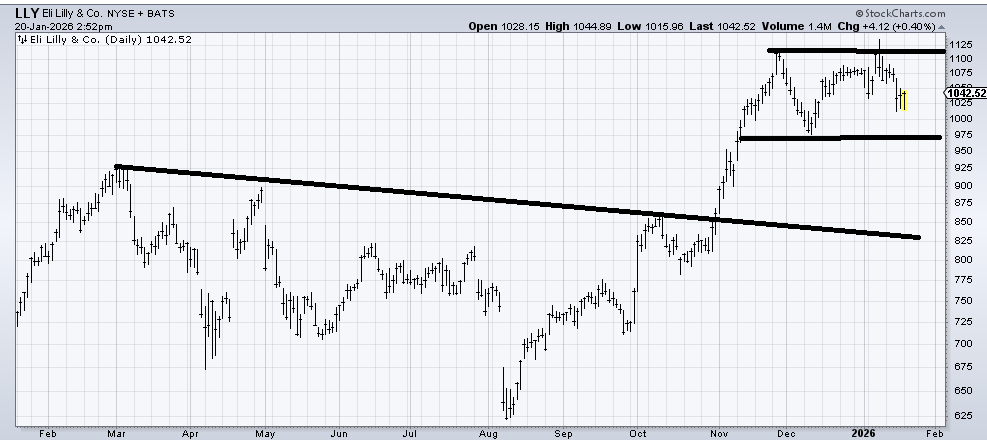
Eli Lilly (LLY) hasn’t done anything wrong, but that base measured to 1125, which is where it got to two weeks ago. Now it either needs a serious correction or some sideways action. For now, I will call it a trading range between 975 and 1125.
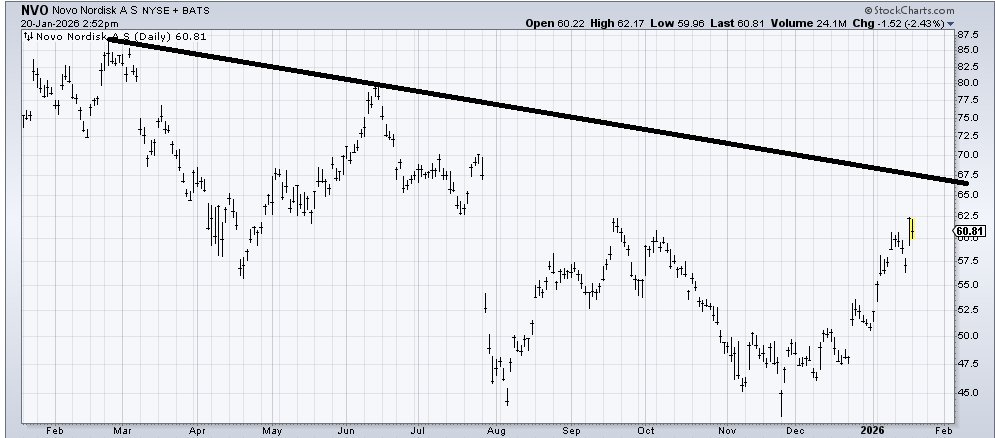
I liked Novo Nordisk (NVO) a few months ago, and it’s still a basing chart, but it could use a pullback to digest the move. I just can’t decide how far down it needs to go. I’m going to call it a hold for now if you can stand some short-term volatility.
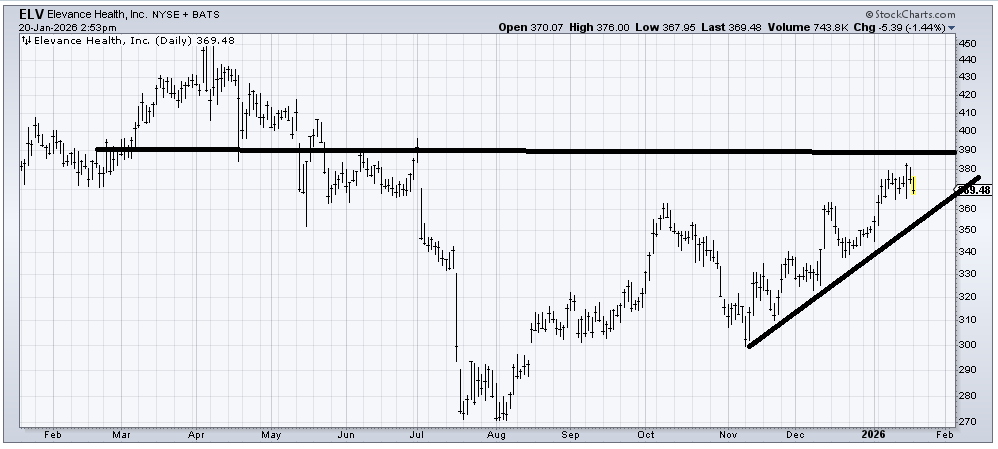
Elevance Health (ELV) is into resistance, so at the very least, I think it needs a pullback to that uptrend line. I would reassess if it breaks the line.
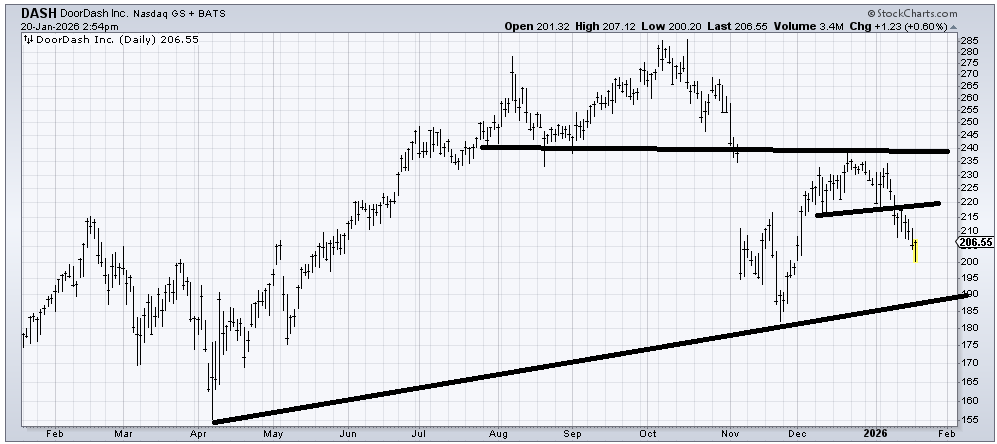
DoorDash (DASH) is in the middle of nowhere, not at support, not at resistance. I’m inclined to think a rally to the 220 area fails and/or a plunge to 190 sees a bounce.
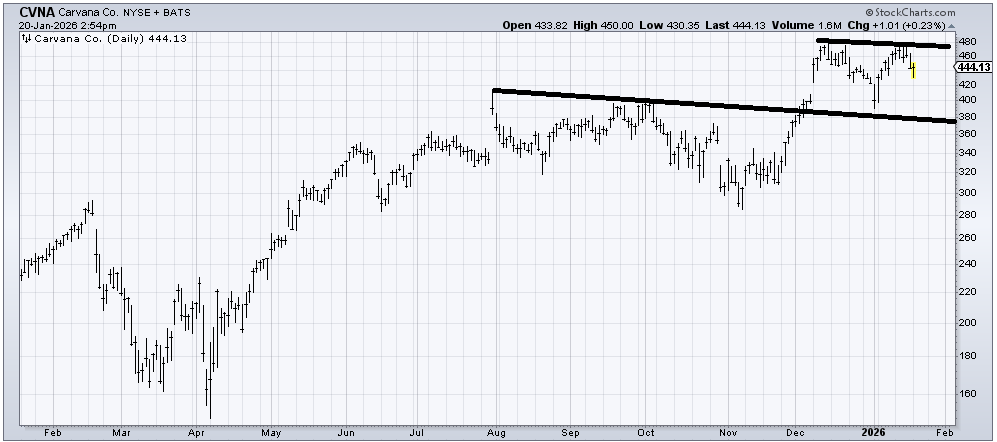
Carvana (CVNA) is another chart in the middle of nowhere. Resistance at 480 and support near 380.
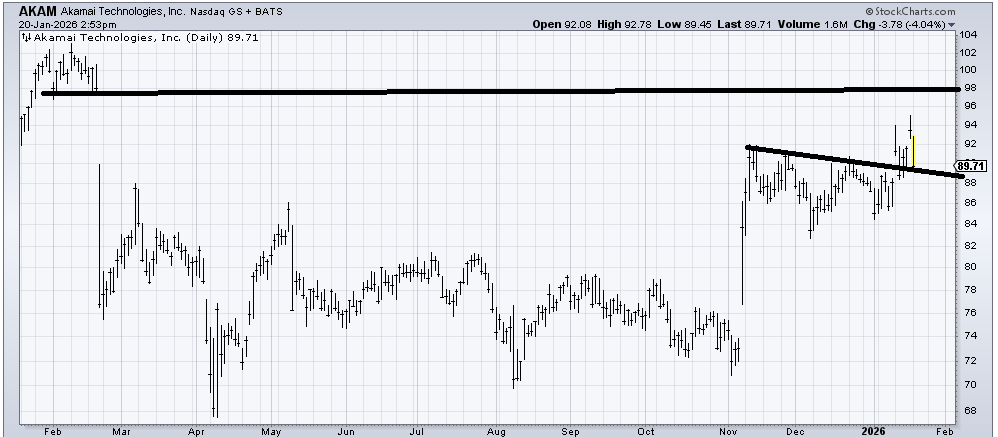
I would have thought Akamai (AKAM) would fill that overhead gap and it hasn’t. Now I would say it needs to hold this 88-ish area. If it holds, then the gap is still in play. I mean, that was a breakout from a base in November so I don’t want to get bearish too soon.