New Workday Trade Idea as Earnings Turn Stock 'Toxic' to Institutions
After some key earnings results fell well short of Wall Street's expectations, here's a trade idea for the firm.
You've reached your free article limit
You've read 0 of 1 free Pro articles.
On Tuesday evening, cloud-based enterprise software platform provider Workday (WDAY) released the firm's fiscal fourth quarter financial results. For the period ended January 31, 2025, the firm that focuses on human capital and financial management and has suffered from the recent industry-wide selloff, posted an adjusted EPS of $2.47 (GAAP EPS: $0.55) on revenue of $2.532 billion.
Both the top- and adjusted bottom-line results did beat Wall Street, while those revenues amounted to a year-over-year gain of 14.5%. However, the GAAP EPS print did fall well short of what Wall Street had in mind. The firm made an adjustment of $1.46 per fully diluted share for the purpose of share-based compensation, which is a little ridiculous.
Do what you want with your capital, but expenses made on a quarterly basis for a firm publicly traded since 2012? Those are known as ordinary operating expenses, bub, and should not be adjusted for.
Operations
As total revenue grew 14.5% to $2.532 billion, total costs and expenses printed at $2.358 billion (10.4%), leaving GAAP operating income of $174 million (up from $75 million). That put the firm's GAAP operating margin at 6.9%, up from 3.4%. Once adjusted, that operating margin improved from 26.4% to 30.6%.
After accounting for interest, other income and expenses and taxes, GAAP net income landed at $145 million (up from $94 million). This works out to $0.55 per fully diluted share versus the year-ago comp of $0.35. Once adjusted, that EPS rises to $2.47, up from $1.92 for the same quarter last year.
Guidance
For the current quarter, Workday is projecting subscription revenue of $2.335 billion, which would be good for annual growth of 13%. Wall Street was looking for something closer to $2.35 billion. An adjusted operating margin of 30.5% is also expected.
For the full fiscal year just started, Workday sees subscription revenue of $9.925 billion to $9.95 billion. Wall Street was looking for $10 billion. This is being taken poorly by investors. That would be good for year-over-year growth of 12% to 13%. The firm sees a full-year adjusted operating margin of 30%.
Fundamentals
For the quarter reported, Workday generated operating cash flow of $1.278 billion. Out of that came capex spending of just $60 million, leaving free cash flow of $1.218 billion (+18.7%). Out of that number, the firm did not pay out a cash dividend to shareholders but did repurchase $1.504 billion worth of common stock. Yes, I know that does not add up.
Moving on to the balance sheet, Workday runs with a cash position of $5.443 billion (hence, the ability to outspend free cash flow on share buybacks) and current assets of $8.429 billion. Current liabilities add up to $6.378 billion. This includes no short-term debt and unearned revenue worth $5.01 billion. That is not a true financial obligation and is actually a balance sheet strength. Once adjusted for those unearned revenues, the firm's current ratios stand at a quite muscular 6.16.
Total assets amount to $18.074 billion, of which 32.7% can be labeled as either "goodwill" or intangible. That's within modern norms. Total liabilities less equity comes to $10.269 billion, including long-term debt of $2.987 billion, which could be taken care of out of pocket. This is a very solid balance sheet and is not a problem for the firm.
Opinion
The guidance is a little tough to look at. Corporate execution has not been bad. Cash flows and the balance sheet are excellent. The stock is being punished now (-10% overnight) and has been punished over time (-58% in less than two years). Now, WDAY trades at just 12-times forward-looking earnings. Hardly expensive. Let's take a look:
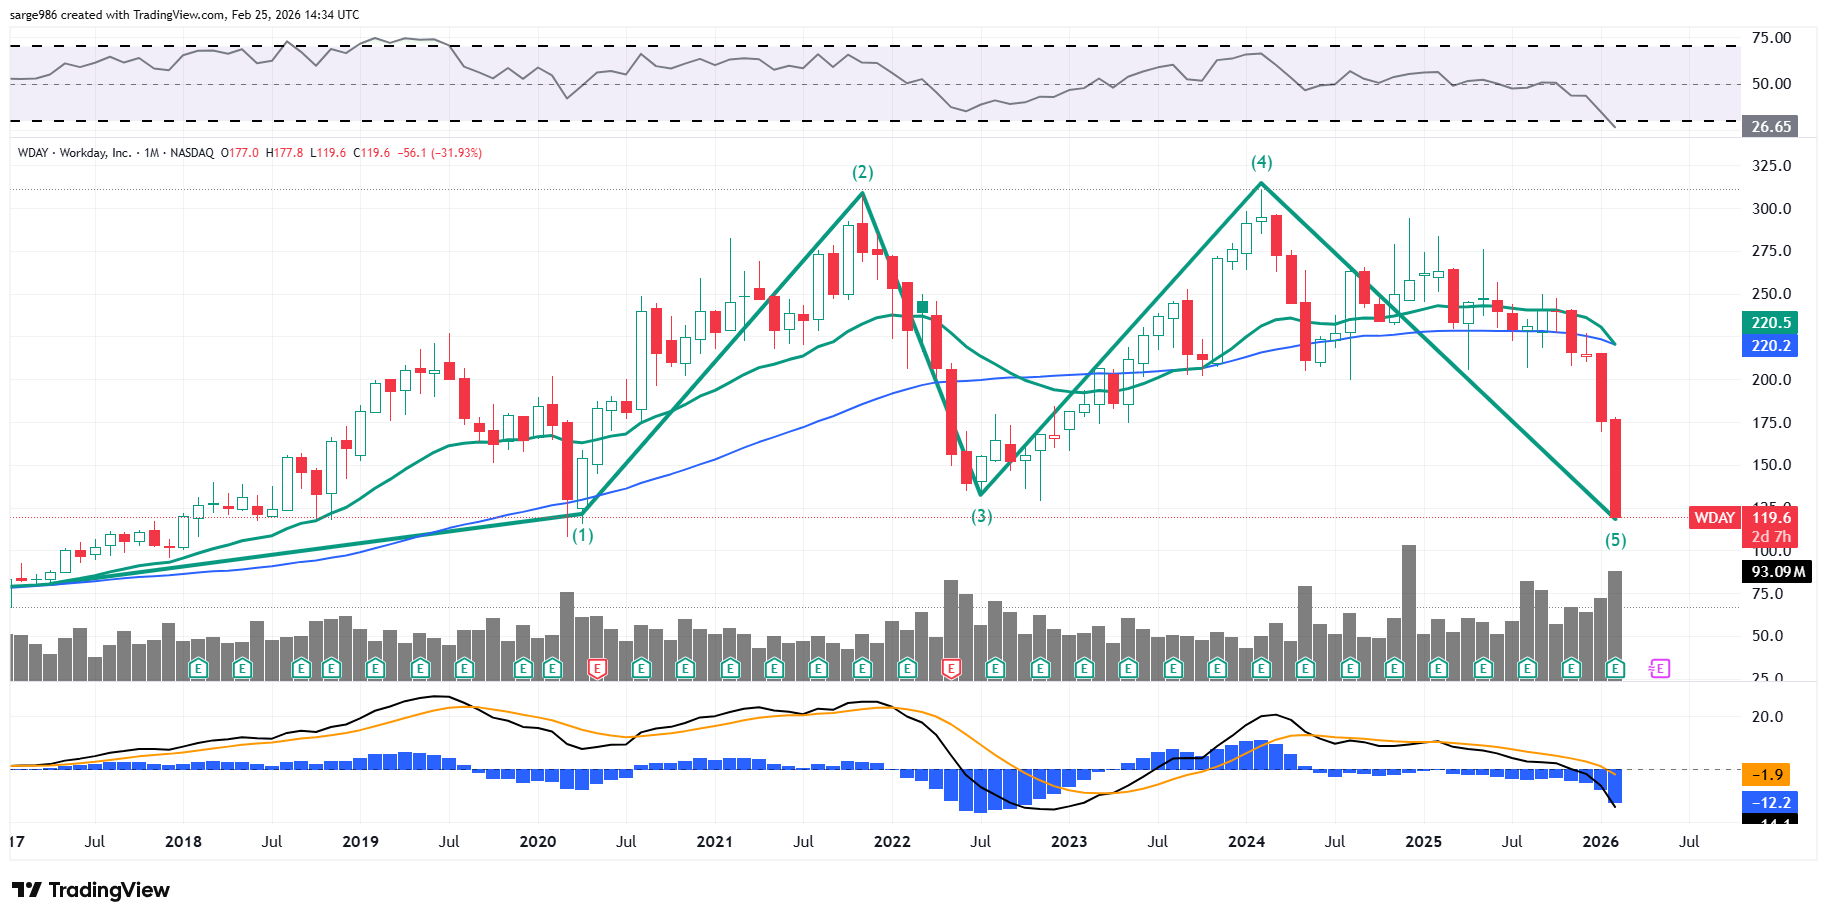
There is really nothing all that useful on the daily chart of this stock. However, if we go to the monthly chart, as we have here, we see a double-top pattern of bearish reversal with peaks in November 2021 and February 2024 that appears to have worked to near perfection. The downside pivot here is $134. I would think a 100% retracement to the lows of March 2020 ($107.75) is very possible in the case of this stock.
The shares are trading at a 35% discount to its 50-day SMA and a 46% discount to its 200-day SMA. That makes this stock toxic at the moment to any institution taking risk management seriously. That full retracement might be where risk managers will give portfolio managers a green light. April 26 $110 puts can be written (sold) for almost $3 at present. That might be an idea.
At the time of publication, Guilfoyle had no positions in any securities mentioned.
